XB-IMG-170155
Xenbase Image ID: 170155

|
|
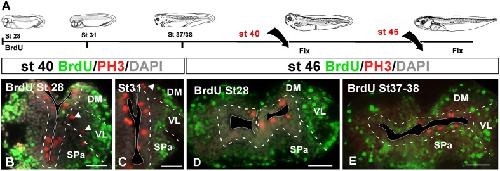
FIGURE 4. Proliferation analysis with BrdU. (A) Schematic drawing illustrating the experimental approach used, in which BrdU was administrated at the embryonic stages specified and the animals were sacrificed at the larval stages indicated. (BâE) Micrographs of transverse sections through the pallium of Xenopus laevis at embryonic (B,C) and premetamorphic larvae (D,E) stages showing the distribution of BrdU labeling in combination to PH3 and DAPI; the color code and the stages analyzed are indicated. The developmental stage of BrdU administration is indicated in each micrograph. After the BrdU administration at early embryonic stages and subsequent processing at late embryonic stages (B,C) and early larvae stages (D), the BrdU+ cells were situated in the mantle zone equally distributed and double PH3/BrdU labeled cells were not detected (B,C), but PH3 mitotic cells in ventricular and abventricular positions were observed (see arrowheads in B,C). After the BrdU administration at late embryonic stages and subsequent processing at early larvae stages (E) there were not PH3/BrdU+ double labeled cells, and the BrdU+ cells were situated in the mantle zone, but additionally in the ventricular layer. Scale bars = 50 μm (BâE). See list for abbreviations. Image published in: Moreno N and González A (2017) Copyright © 2017 Moreno and González. Creative Commons Attribution license Larger Image Printer Friendly View |
