XB-IMG-170729
Xenbase Image ID: 170729
|
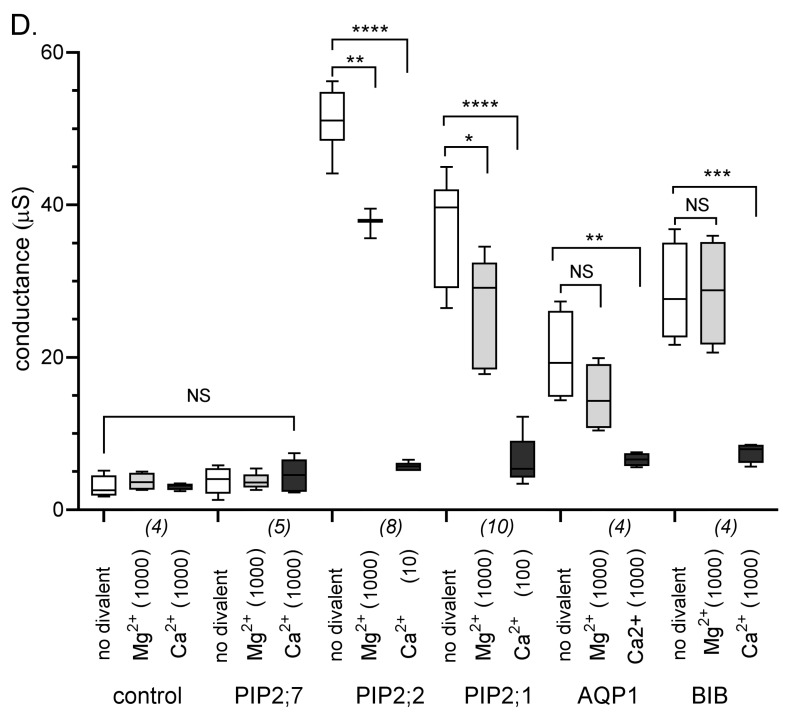
Figure 2. Effects of Mg2+ and Ca2+ divalent cations on ionic current responses in oocytes expressing different classes of AQPs. (A) Superimposed currents as a function of time measured by voltage clamp (steps from −110 to +60 mV, from a holding potential of −40 mV) at maximal activation in divalent-free saline (left), after application of Mg2+ (middle), and after application of Ca2+ (right). Control and PIP2;7-expressing oocytes lacked appreciable conductances. (B) Current-voltage relationships for the traces illustrated in (A). (C) Na+ concentrations in oocytes expressing PIP2;2 as compared with control oocytes after incubation in Frog Ringers containing 96 mM NaCl for three days. Data are from four replicates; each replicate contained five oocytes. (D) Box plot summary of compiled data for the conductances. Free Ca2+ concentrations are given in μM. **** (p < 0.0001); *** (p < 0.001); ** (p < 0.01); * (p < 0.05); NS (not significant); using ANOVA with post-hoc Bonferroni tests. n values are in italics below the x-axis. Image published in: Kourghi M et al. (2017) © 2017 by the authors. This image is reproduced with permission of the journal and the copyright holder. This is an open-access article distributed under the terms of the Creative Commons Attribution license Larger Image Printer Friendly View |