XB-IMG-170731
Xenbase Image ID: 170731
|
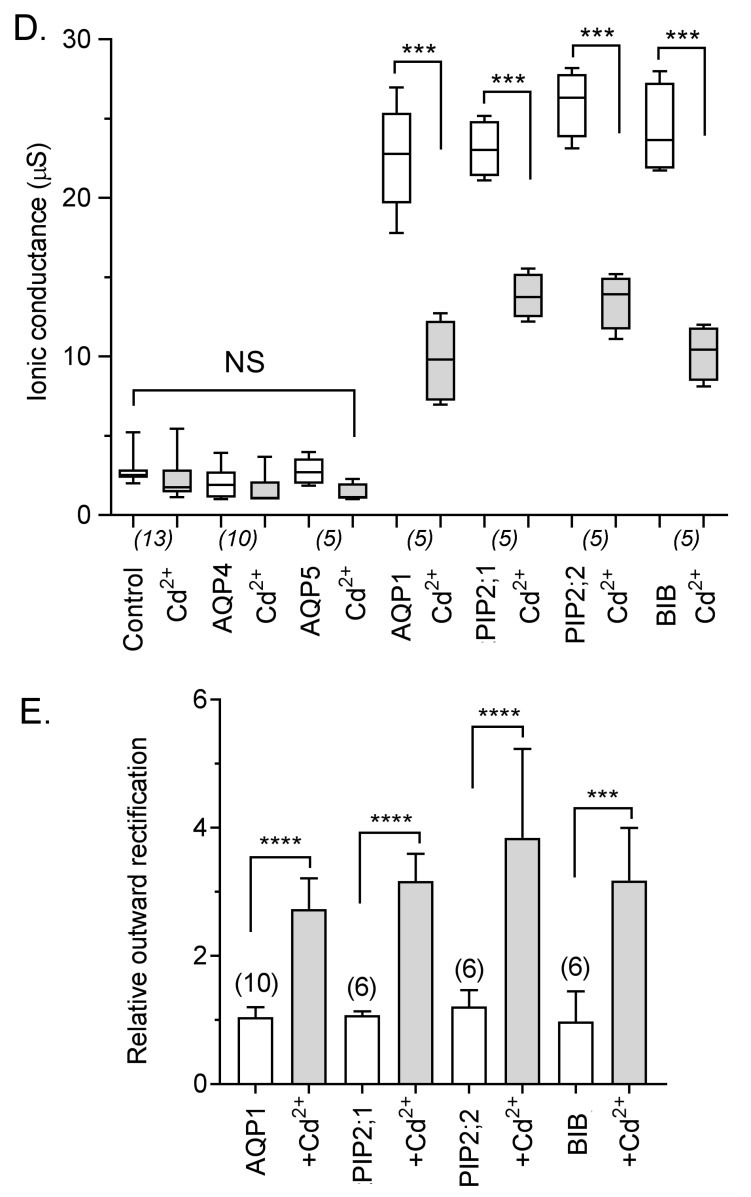
Figure 4. Effects of Cd2+ on ion current responses in oocytes expressing different classes of AQPs. (A) Superimposed current traces under voltage clamp recorded at maximal activation (if present) in divalent-free saline (left) and after perfusion with bath saline containing 1 mM CdCl2 (right). (B) Current-voltage relationships for data presented in (A). (C) Rates of onset of block after perfusion of bath saline containing 1 mM Cd2+, as measured using repeated voltage steps to +40 mV. (D) Box plot summary of compiled data for control, AQP4, AQP5, AQP1, PIP2;1, PIP2;2 and BIB expressing oocytes before and after Cd2+ application. n values are below the x-axis. (E) Histogram showing relative outward rectification values (mean ± SEM), calculated as the ratio of outward to inward currents at +60 and −80 mV (I+60/I-80). **** (p < 0.0001); *** (p < 0.005); NS (not significant); using ANOVA with post-hoc Bonferroni tests; n values are shown above the histogram bars. Image published in: Kourghi M et al. (2017) © 2017 by the authors. This image is reproduced with permission of the journal and the copyright holder. This is an open-access article distributed under the terms of the Creative Commons Attribution license Larger Image Printer Friendly View |