XB-IMG-171504
Xenbase Image ID: 171504
|
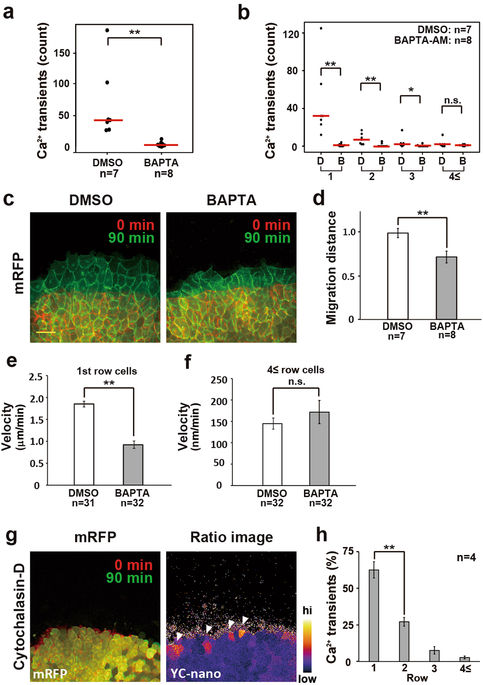
Figure 4. Ca2+ transients are required for LEM migration. (a) Ca2+ transients in DMZ explants treated with BAPTA-AM for 3âhours. Red bars indicate average values. DMSO: nâ=â7 embryos and BAPTA-AM (50âμM): nâ=â8 embryos. MannâWhitney U-test, **Pâ<â0.005. (b) Location of calcium transients during LEM migration in BAPTA-AM- or DMSO-treated DMZ explants. nâ=â8 embryos. Red bars indicate average values. MannâWhitney U-test, **Pâ<â0.005, *Pâ<â0.05, n.s.: No significance. (c) Migration of DMZ explants treated with or [without] DMSO. Migration was suppressed by BAPTA-AM treatment. Scale bar: 100âμm. (d) Relative migration distance in DMSO- or BAPTA-AM-treated DMZ explants. Values were normalized to the migration distance of DMSO-treated explants. Error bars indicate s.e. ± Studentâs t-test, **Pâ<â0.005. (e) Migration velocity of leader cells in DMSO- or BAPTA-AM-treated DMZ explants. Error bars indicate s.e. ± Studentâs t-test, **Pâ<â0.005. (f) Migration velocity of follower cells (â¥4th) in DMSO- or BAPTA-AM-treated DMZ explants. Error bars indicate s.e. ± Studentâs t-test, n.s.: No significance. (g) Left: Snapshot from time-lapse imaging. Cytochalasin-D (1âμM) treatment suppressed the migration activity in DMZ explants. Right: Ca2+ imaging of DMZ explants treated with Cytochalasin-D (1âμM). White arrowheads indicate Ca2+ transients. (h) Location of Ca2+ transients during 3âhours of Cytochalasin-D (1âμM) treatment. Error bars indicate s.e. ± Studentâs t-test, **Pâ<â0.005. Image published in: Hayashi K et al. (2018) © The Author(s) 2018. Creative Commons Attribution license Larger Image Printer Friendly View |