XB-IMG-172396
Xenbase Image ID: 172396
|
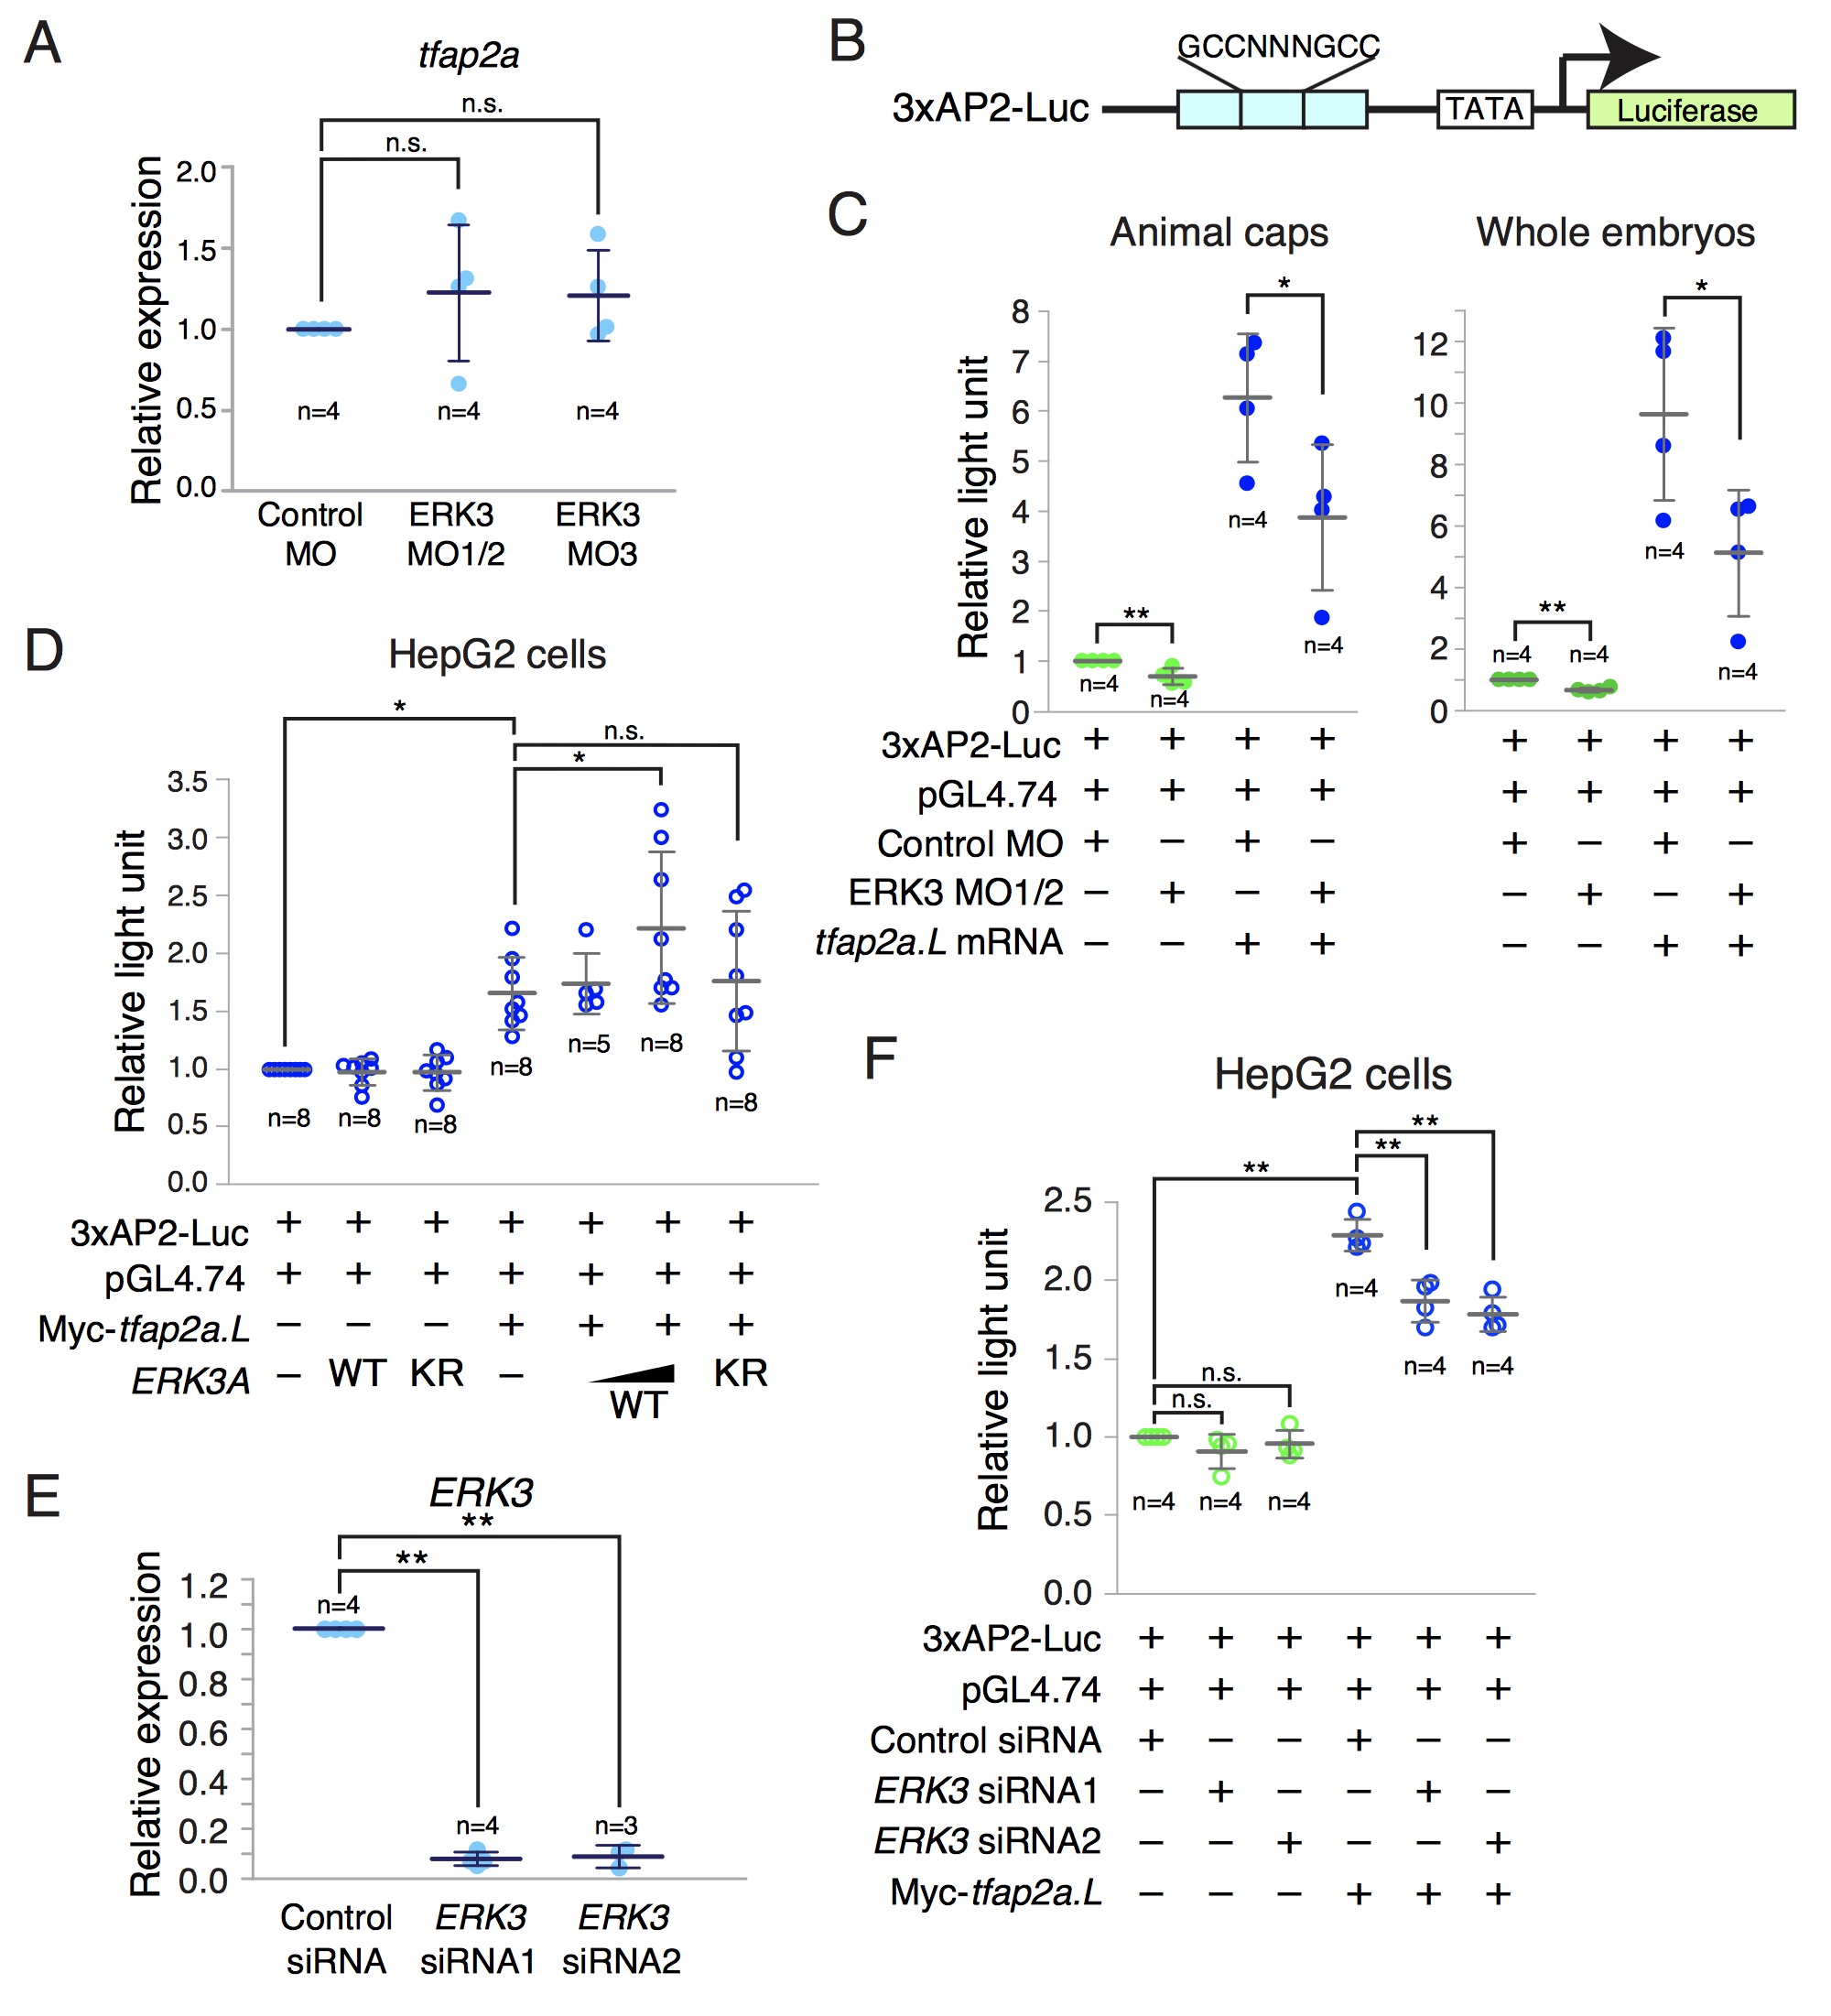
Figure 14. ERK3 regulates TFAP2A-dependent transcription. A, Real-time quantitative RT-PCR analysis of tfap2a expression in Xenopus laevis embryos. Control MO (40 ng), ERK3 MO1/2 (20 ng each MO1 and MO2) or ERK3 MO3 (40 ng) was injected into both ventral blastomeres at the 4-cell stage. Injected embryos were harvested at stage 14. The expression levels of tfap2a were normalized to those of odc. All data points from four independent experiments are shown. The bars represent the average±S.D. The normalized tfap2a expression level in control embryos was defined as 1.0 in each experiment. n.s., not significant by Dunnett test. B, The TFAP2-Luc reporter (3xAP2-Luc) contains three tandem repeats of the consensus binding sequence (GCCNNNGCC) of the TFAP2 family to drive firefly luciferase expression. C, Luciferase assays using Xenopus laevis embryos. Indicated combinations of control MO (40 ng), ERK3 MO1/2 (20 ng each of MO1 and MO2), and tfap2a.L mRNA (1 ng) were co-injected with the 3xAP2-Luc plasmid (20 pg) and the pGL4.74 Renilla luciferase plasmid (20 pg) into the animal regions at the 2-cell stage. Animal caps dissected at stage 9 or whole embryos were lysed at stage 13 for the dual luciferase assay, in which firefly luciferase activity was normalized to the internal control Renilla luciferase activity. Shown are all data points from four independent experiments. The bars represent the average±S.D. The normalized relative light unit for firefly luciferase in control animal caps or embryos was defined as 1.0 in each experiment. *P<0.05, **P<0.01 by t-test. D, 3xAP2-Luc (150 ng) and pGL4.74 (10 ng) plasmids were transfected with the indicated combinations of the expression plasmids for ERK3A WT (300 or 600 ng), ERK3A KR (600 ng) or Myc-tagged tfap2a.L (600 ng) into HepG2 cells. The total amount of plasmids was kept constant by adding the mock vector. After 24 hours, the cells were lysed for dual luciferase assays. Shown are all data points from 5-8 independent experiments. The bars represent the average±S.D. The normalized relative light unit for firefly luciferase in control cells was defined as 1.0 in each experiment. *P<0.05 by Dunnett test. n.s., not significant. E, Real-time quantitative RT-PCR analysis of ERK3 expression. HepG2 cells were transfected with 20 nM control siRNA, ERK3 siRNA1 or ERK3 siRNA2, cultured for 48 hours, and then subjected to analyses. The mock plasmid was also transfected to examine the efficiency of siRNAs in the presence of co-delivering plasmid DNAs. Shown are all data points from three or four independent experiments. The expression levels of human ERK3 were normalized to those of human GAPDH. The bars represent the average±S.D. The normalized ERK3 expression level in control cells was defined as 1.0 in each experiment. **P<0.01 by Dunnett test. F, The 3xAP2-Luc plasmid (1 g), the pGL4.74 plasmid (40 ng) and the indicated siRNA (20 nM) were simultaneously transfected into HepG2 cells with or without the expression plasmid for Myc-tagged tfap2a.L (0.96 g). The total amount of plasmids was kept constant by adding the mock vector. After 48 hours, the cells were harvested for dual luciferase assay. Shown are all data points from four independent experiments. The bars represent the average±S.D. The normalized relative light unit for firefly luciferase in control cells was defined as 1.0 in each experiment. **P<0.01 by Tukey test. n.s., not significant by Tukey test. Image published in: Takahashi C et al. (2018) Copyright © 2018. Image reproduced with permission of the publisher and the copyright holder. This is an Open Access article distributed under the terms of the Creative Commons Attribution License. Larger Image Printer Friendly View |