XB-IMG-172619
Xenbase Image ID: 172619
|
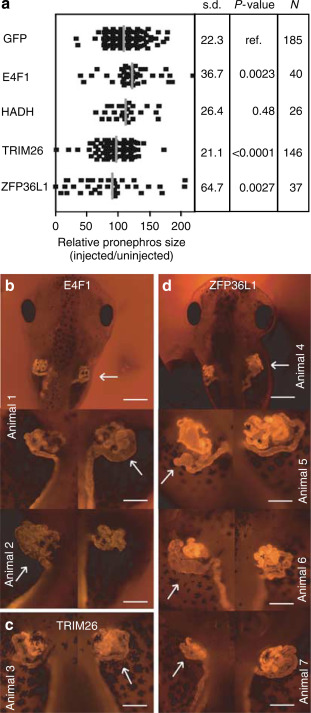
Figure 3. Influence of over-expressed HNF1β interaction partners on pronephros development in Xenopus larvae. (a) The size of pronephros on injected versus control side is given. The size was determined in lateral views by measuring the area through the widest part of the immunostained pronephros as described.17 Data were tested for Gaussian distribution and accordingly the Student's t-test was used to score significant differences. The P-value is given by comparing embryos injected with interaction partner plus GFP mRNA as marker with those injected with GFP mRNA only. N is the number of animals investigated. (b) E4F1-injected larvae are immunostained to detect pronephric tubule and duct using the antibodies 3G8 and 4A6 as described.17 The upper panel is a dorsal view and the middle panel gives lateral views (right and left) of the same larvae (animal 1). The bottom panel represents the lateral views from a distinct individual (animal 2). In all the lateral views, anterior is up and the injected side is marked by an arrow. (c) Lateral views of a TRIM26-injected larvae (animal 3) prepared as in (b). (d) ZFP36L1-injected larvae prepared as in (b) with a dorsal view (top panel, animal 4) and lateral views of three distinct larvae (animals 5–7). Bar=500 and 200 μm in the dorsal view and lateral views, respectively. Image published in: Dudziak K et al. (2008) Copyright © 2008. This image is reproduced with permission of the publisher and the copyright holder. This is an Open Access article distributed under the terms of the Creative Commons Attribution License. Larger Image Printer Friendly View |