XB-IMG-172644
Xenbase Image ID: 172644
|
Fig. 3.
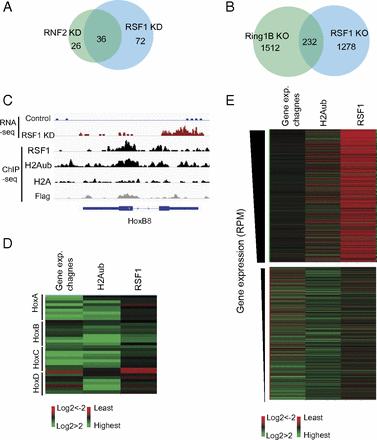
RSF1 and RNF2/Ring1B modulate the expression of a large cohort of common targets in human and mouse cells. (A) Venn diagram shows the overlap of the genes with significant changes in expression in RNF2 or RSF1 KD HeLa cells. (B) Venn diagram shows the overlap of the genes with significant changes in expression in Ring1B or RSF1 KO mouse ESCs. (C) Representative images of the HoxB8 gene locus showing data obtained from the RNA-seq (Top two panels), RSF1 ChIP-seq (third panel), and H2Aub ChIP-seq (fourth panel) assays in mouse ESCs containing RSF1-Flag-HA knockin. Parallel H2A and Flag ChIP in parental ESCs were shown as controls. Gene diagrams are shown (Bottom). (D) Heatmaps shows fold-changes of the expression of the Hox genes in RSF1 KO mouse ESCs compared with control wild-type ESCs from RNA-seq data (first column), tag counts for H2Aub ChIP-seq data (second column), and RSF1 ChIP-seq data (third column) in control wild-type ESCs within 5 kb of gene TSS. The tag counts are RPM-normalized and background-subtracted. (E) Heatmaps shows fold-changes in the expression of all genes in RSF1 KO mouse ESCs compared with wild-type control ESCs from RNA-seq data (first column), tag counts for H2Aub signal (second column), and RSF1 signal (third column) in control wild-type ESCs within 5 kb of gene TSS. Genes are ranked by their expression levels and only the top and bottom 1,000 genes are shown. The tag counts are RPM-normalized and background subtracted. Image published in: Jones AE et al. (2017) Copyright © 2017. Image reproduced with permission of the publisher and the copyright holder. This is an Open Access article distributed under the terms of the Creative Commons Attribution License. Larger Image Printer Friendly View |