XB-IMG-172748
Xenbase Image ID: 172748
|
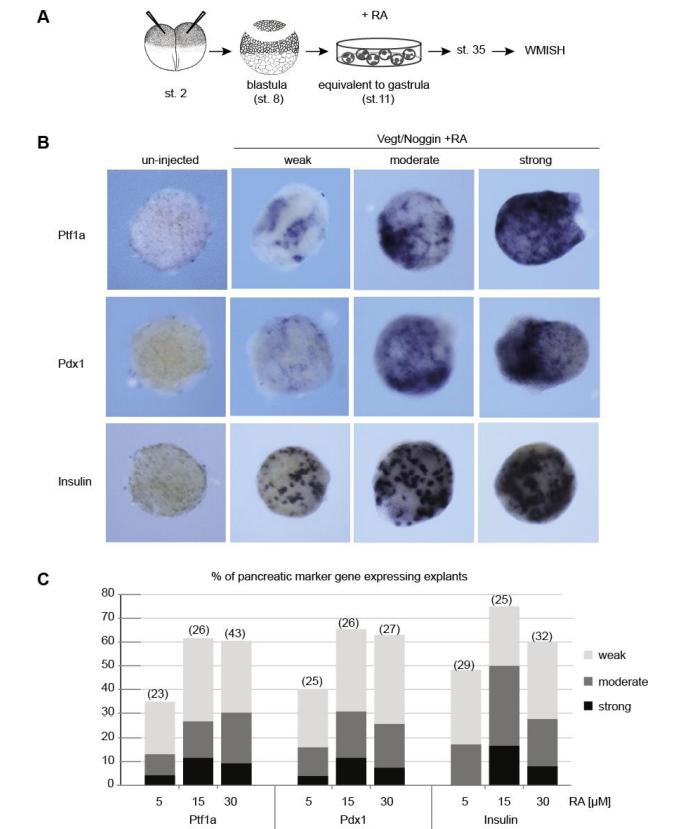
Fig. S1. Distribution of pancreatic cells in programmed explants
(A) Co-injection of vegt and noggin mRNAs into the animal pole of two cell stage embryos.
Explants were treated with three different concentrations of RA (5, 15 and 30µM) at the
equivalent of stage 11 for 1h and used for WMISH at the equivalent of stage 35. (B) Different
categories according to the intensity of pancreatic marker gene expression are presented.
(C) Diagram reflecting the percentage of explants positive for pancreatic marker gene
expression in the different categories. The total number of explants analyzed is indicated in
brackets. Image published in: Gere-Becker MB et al. (2018) © 2018. This image is reproduced with permission of the journal and the copyright holder. This is an open-access article distributed under the terms of the Creative Commons Attribution license Larger Image Printer Friendly View |