XB-IMG-173200
Xenbase Image ID: 173200
|
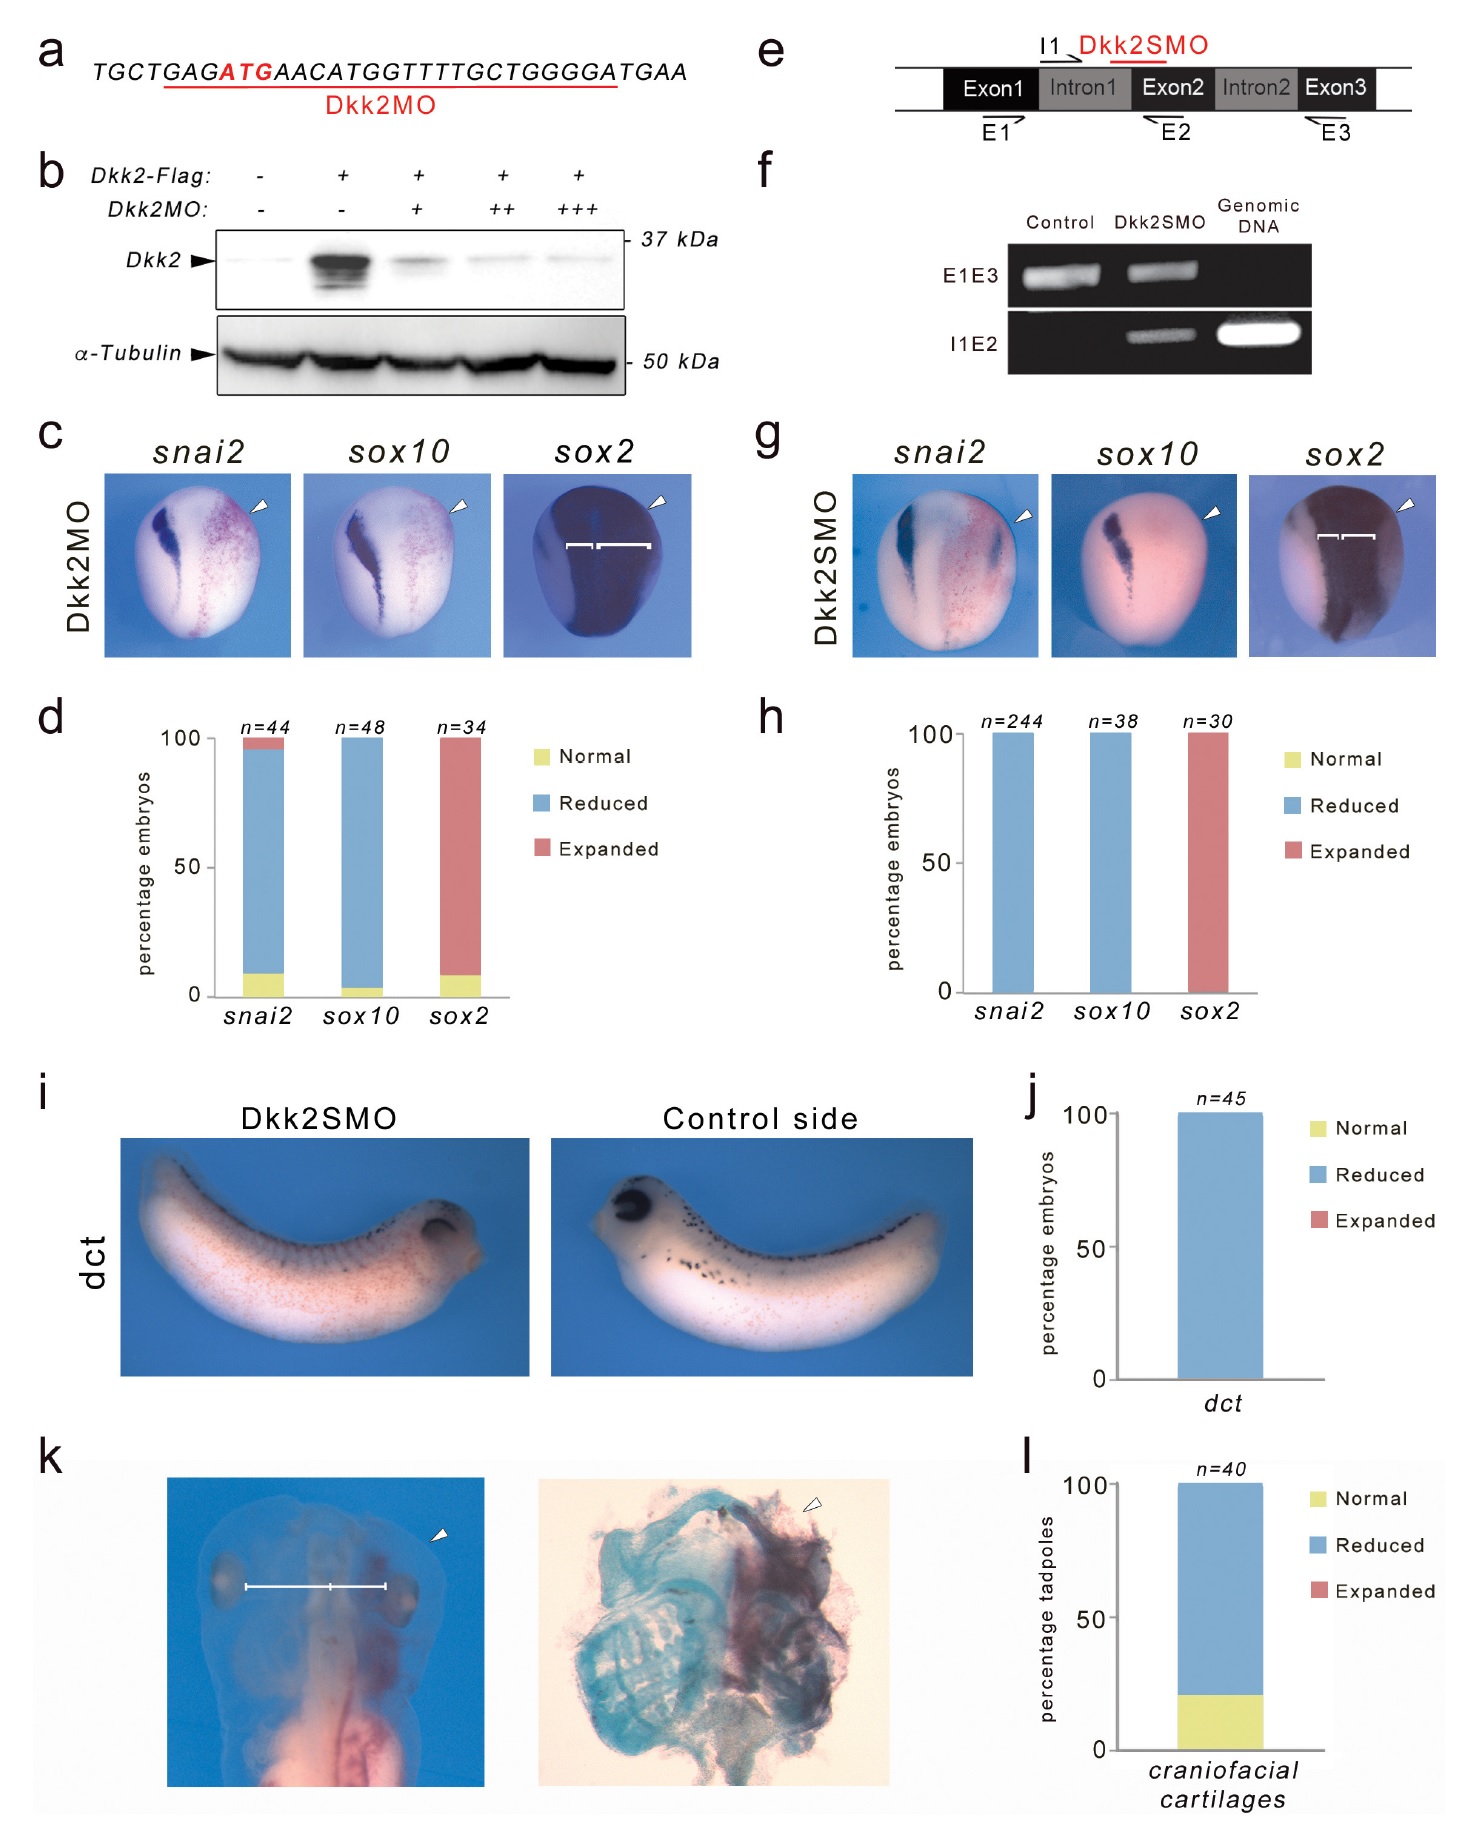
Figure 1. Dkk2 knockdown blocks neural crest formation in vivo. (a) The translation blocking MO (Dkk2MO) targets the initiation codon. (b) Western
blot using lysates from embryos injected with Dkk2-Flag mRNA (10 ng) alone or in combination with increasing amounts of Dkk2MO, 2 ng (+), 5 ng (+
+), and 10 ng (+++), shows that Dkk2MO blocks Dkk2 protein accumulation in vivo. a-tubulin is shown as a loading control. (c) Unilateral injection of
Dkk2MO (30 ng) at the 2 cell stage caused a reduction of snai2 and sox10 expression and a lateral expansion of sox2 expression domain (brackets). The
injected side (arrowheads) is to the right as indicated by the presence of the lineage tracer (Red-Gal). Dorsal views, anterior to top. (d) Quantification of
the Dkk2MO phenotype. (e) Schematic representation of the dkk2 locus. The PCR primers used for the analysis of spliced transcripts are indicated. The
position of the splice (Dkk2SMO) blocking MO is shown (red). (f) In Dkk2SMO-injected embryos a larger dkk2 transcript is detected due to intron 1
retention. For all samples, the RT-PCR was performed under the same experimental conditions. (g) Unilateral injection of Dkk2SMO (30 ng) also
resulted in a reduction of snai2 and sox10 expression and a lateral expansion of sox2 expression domain (brackets). The injected side (arrowheads) is to
the right as indicated by the presence of the lineage tracer (Red-Gal). Dorsal views, anterior to top. (h) Quantification of the Dkk2SMO phenotype. (i) At
stage 30, Dkk2SMO-injected embryos show reduced dct expression. Lateral views, dorsal to top. (j) Quantification of the Dkk2SMO phenotype. (k) At
stage 45, Dkk2SMO-injected tadpoles (20 ng) have reduced craniofacial structures (left panel). The white line indicates the distance between the brain
and the eyes. These tadpoles have reduced craniofacial cartilages as revealed by alcian blue staining (right panel). In both panels the injected side
(arrowheads) is to the right as indicated by the presence of the lineage tracer (Red-Gal). Ventral view, anterior to top. (l) Quantification of the results
from three independent experiments. In all the graphs (d, h, j, l), the number of embryos analyzed (n) is indicated on the top of each bar. Image published in: Devotta A et al. (2018) © 2018, Devotta et al. This image is reproduced with permission of the journal and the copyright holder. This is an open-access article distributed under the terms of the Creative Commons Attribution license
Image source: Published Larger Image Printer Friendly View |