XB-IMG-173286
Xenbase Image ID: 173286
|
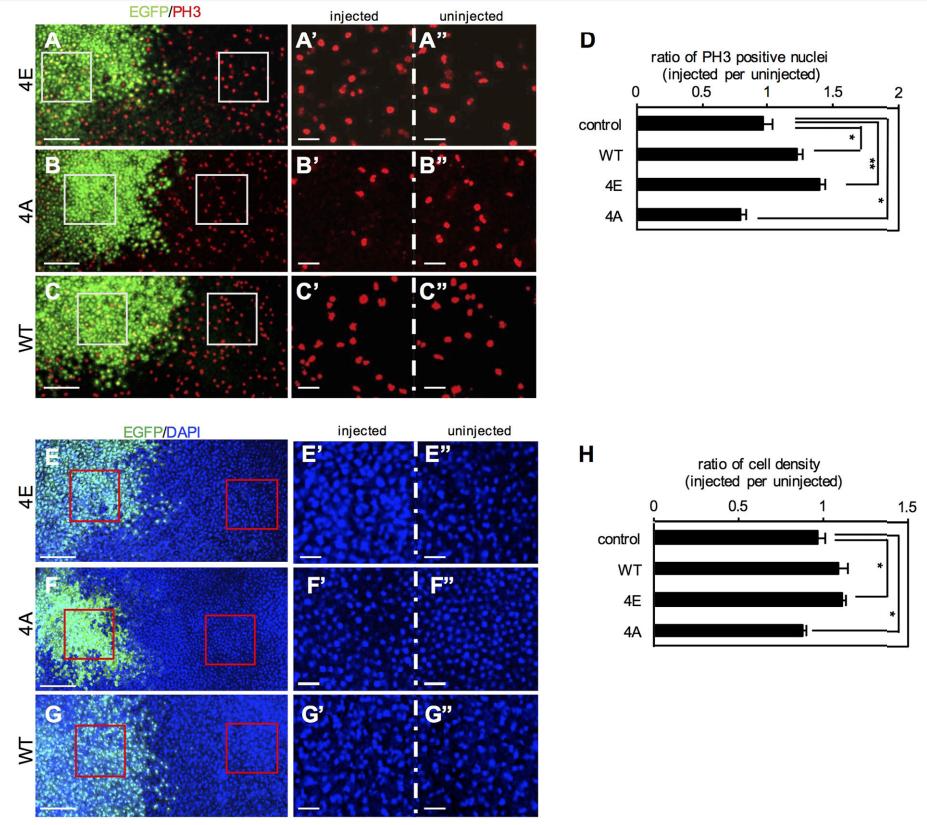
Fig. 5. Phosphomimetic Otx2-4E stimulates cell proliferation. (A-C) mRNA for Otx2-4E (A), -4A (B) or -WT (C) together with EGFP as a tracer was injected into one blastomere at the four-cell stage. Embryos were immunostained for PH3 at the late gastrula stage. PH3-positive nuclei are shown in red, Otx2 mutantexpressing cells (expressing EGFP) are shown in green. White boxes indicate enlarged areas (A′-C′). (D) Quantitative analysis of PH3-positive nuclei. More than 90 PH3-positive nuclei were counted in one embryos, and six to ten embryos were analyzed for calculating the mean ratio (and s.e.m.) of the number of PH3-positive nuclei in injected versus uninjected areas. (E-G) Representative images of DAPI-stained nuclei in Otx2-4E (E), -4A (F) or -WT (G)-expressing gastrula embryos. Nuclei are shown in blue, and Otx2 mutant-expressing cells (expressing EGFP) are shown in green. Red boxes indicate enlarged areas (E′-G′). The dorsoanterior region was observed. (H) Quantitative analysis of cell numbers. More than 500 nuclei in total were counted in one embryo, and five to seven embryos were analyzed for calculating the mean ratio (and s.e.m.) of the number of nuclei in injected versus uninjected areas. **P<0.01, *P<0.05 (Student’s t-test); error bars, s.e.m. (D,G). Scale bars: 200 μm in A-G; 50 μm in A′-G′. Image published in: Satou Y et al. (2018) Copyright © 2018. Image reproduced with permission of the publisher and the copyright holder. This is an Open Access article distributed under the terms of the Creative Commons Attribution License. Larger Image Printer Friendly View |