XB-IMG-173945
Xenbase Image ID: 173945
|
|
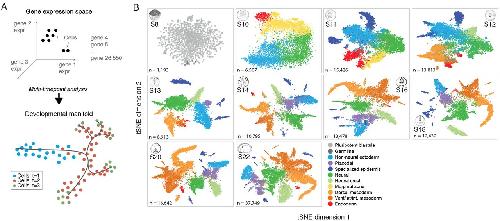
Fig. 1 Dissection of early Xenopus tropicalis development by scRNA-seq.
(A) Single-cell transcriptomes represent points in a high-dimensional gene expression space. By collecting single-cell transcriptomes over time of embryo development, it is possible to infer a continuum gene expression manifold connecting cell states across all lineages. (B) Summary of scRNA-seq developmental timecourse including 136,966 single-cell transcriptomes sampled over ten embryonic stages (S8-22). tSNE plots show increasing cell population structure over time. Colors indicate major tissues grouped by germ layer. Image published in: Briggs JA et al. (2018) Copyright © 2018. Reprinted with permission from AAAS. Readers may view, browse, and/or download this image for temporary copying purposes only, provided these uses are for noncommercial personal purposes. Except as provided by law, this material may not be further reproduced, distributed, transmitted, modified, adapted, performed, displayed, published, or sold in whole or in part, without prior written permission from the publisher. Larger Image Printer Friendly View |