XB-IMG-174940
Xenbase Image ID: 174940

|
|
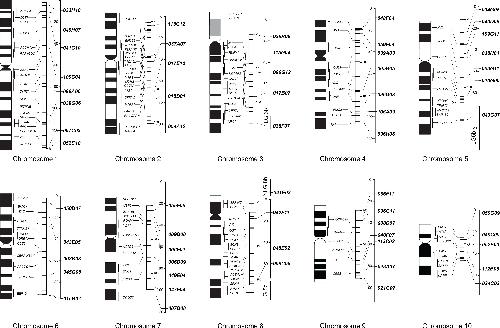
Fig 2. Alignment of physical and genetic linkage maps of X. tropicalis.
Left = FISH cytogenetic map [16]. Middle = physical map from full nucleotide sequence data (JGI X. tropicalis genome assembly 7.1). Right = genetic map based on linkage analysis [12]. The sixty loci used in our analyses are indicated on the right. All maps are size proportional. Physical nucleotide units are mega base (Mbp), and genetic map units are centimorgan (cM). Image published in: Igawa T et al. (2015) Image reproduced on Xenbase with permission of the publisher and the copyright holder. Creative Commons Attribution license Larger Image Printer Friendly View |
