XB-IMG-176006
Xenbase Image ID: 176006

|
|
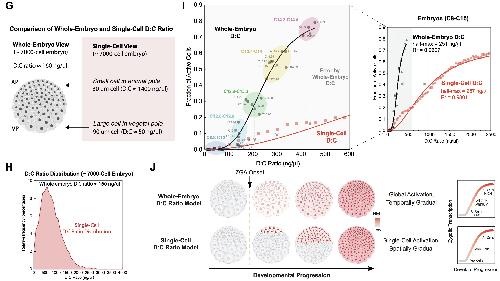
Figure S2. Patterning of Cell Size and ZGA in Early Development: Zygotic Gene Expression Depends on Cell Size But Not Time. Related to Figure 3. (G-J).
(G) Schematic of comparison of whole-embryo D:C ratio and single-cell D:C ratio in a ~ 7000-cell embryo which is to
initiate ZGA. To simplify the calculations for D:C ratio, DNA content in each nucelus averaged from 2N to 4N, which is
3N, is used and cytoplasmic volume is ~ 50% of cell volume that is subtracted with nucleus volume (excluding volumes
of yolk granules). While there is a broad cell size variation in a single staged blastula embryo, the volume of embryo
remains a constant throughout the early cleavages. AP, animal pole; VP, vegetal pole.
(H) Distribution of D:C ration in a ~ 7000-cell embryo which is to initiate ZGA. Data were binned by 100 increments of
D:C ratio from single cells. D:C ratio varies dramatically within a single staged blastula embryo. Dashed line indicates
whole-embryo D:C ratio.
(I) D:C ratio as a function of fraction of transcriptionally active cells for both whole-embryo D:C ratio and single-cell D:C
ratio. Data were from 40 embryos from C8-C15. The left panel is a blowup view of the gray region in the right panel. For
whole-embryo D:C ratio, each circular dot represents one embryo at indicated developmental stages (log2
cell number)
and the colored regions indicate grouped embryos at indicated ranges. For single-cell D:C ratio, each light red square
represents single-cell data binned by 40 increments of single-cell D:C ratio. Both data were fitted with Hill function. The
dashed lines indicate half max D:C ratio derived from respective fittings with Hill function. The dashed double-headed
arrows in both left and right panels indicate error caused by whole-embryo D:C in predicting ZGA onset and patterning.
(J) Predicted pattern of large-scale ZGA based on the DNA:cytoplasm ratio of a whole-embryo vs. of indiivudal cells in
a Xenopus blastula embryo. Image published in: Chen H et al. (2019) Copyright © 2019. Image reproduced with permission of the Publisher, Elsevier B. V. Larger Image Printer Friendly View |
