XB-IMG-176579
Xenbase Image ID: 176579
|
|||||||||||||||||
|
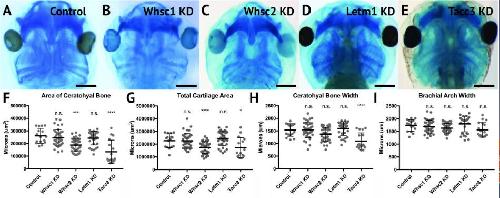
FIGURE 4. Knockdown of Whsc2 and Tacc3 impact cartilage morphology. (AâE) Ventral view of 6dpf embryos following single WHS-assoc. gene KD, stained with Alcian Blue to label cartilage elements. (FâI) Measurements of the average area and width of the ceratohyal cartilage, total cartilage area, and width of the brachial arches. Neither Whsc1 nor Letm1 KD caused a significant change in any measured parameter. Whsc2 KD caused a 27.94% decrease in average area of the ceratohyal cartilage, and a 23.87% decrease in area of all craniofacial cartilage. Tacc3 KD caused a 48.5% decrease in the average area of the ceratohyal cartilage, a 24.03% decrease in total cartilage area, and a 28.58% decrease in ceratohyal cartilage width. Significance was determined using a studentâs unpaired t-test. (Embryos quantified: Control = 17, Whsc1 KD = 41, Whsc2 KD = 39, Letm1 KD = 34, Tacc3 KD = 11.) ââââP < 0.0001, âââP < 0.001, âP < 0.05, n.s., not significant. Scalebar is 250μm. Image published in: Mills A et al. (2019) Copyright © 2019 Mills, Bearce, Cella, Kim, Selig, Lee and Lowery. Creative Commons Attribution license
Larger Image Printer Friendly View |