XB-IMG-176580
Xenbase Image ID: 176580
|
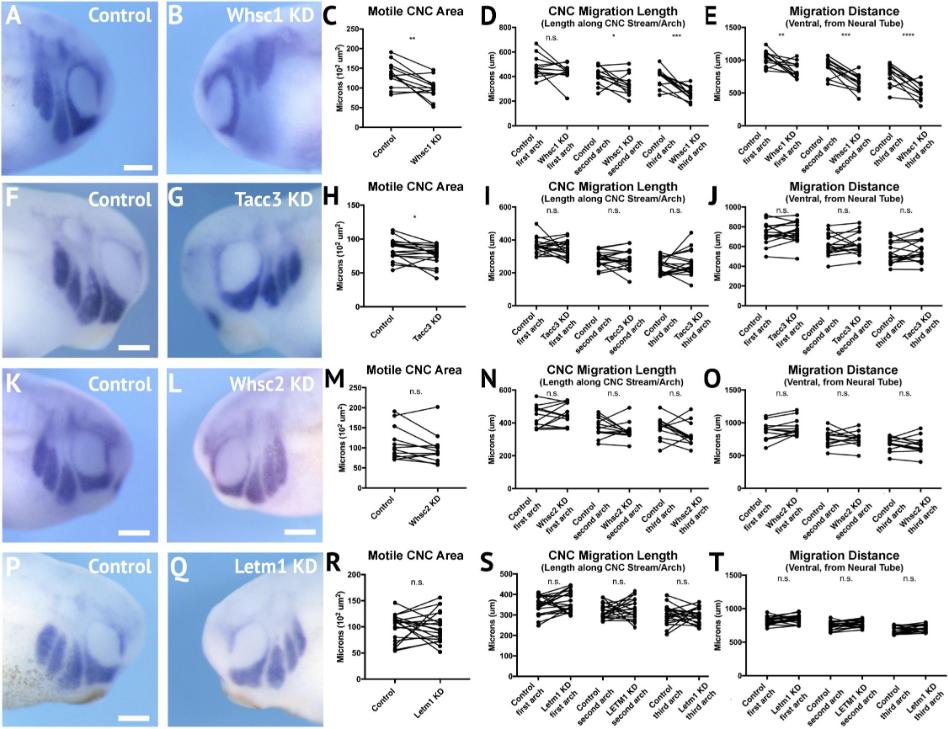
FIGURE 5. Knockdown of Whsc1 and Tacc3 decrease CNC migration in vivo. (A,B,F,G,K,L,P,Q) Anterior lateral views of tailbud stage embryos (depicted at st. 27), following whole mount in situ hybridization against twist. Each column of panels (A,B,F,G,K,L,Q) are lateral views of two sides of the same embryo. (CâE,HâJ,MâO,RâT) Measurements were taken for the total area of the three PA (Arch 1-3 extend anterior to posterior), the length of each individual arch, and the migration distance, as measured from the dorsal most tip of each arch to the neural tube. Embryos were stained and quantified at stages 25â30. (KâT) Letm1 or Whsc2 KD did not significantly affect any of the measured parameters. (FâJ) Tacc3 KD expression caused an 8.33% decrease in the total PA area, but did not affect length or arch migration. (AâE) Whsc1 KD caused a 23.57% decrease in PA area. Additionally, the length of the second and third pharyngeal arches decreased by 14.72 and 31.70%, respectively. The migration distance of the first, second and third pharyngeal arches decreased by 15.75, 24.04, and 29.29%, respectively. Significance determined using a studentâs paired t-test. (Embryos quantified: Whsc1 KD = 13, Tacc3 KD = 18, Whsc2 KD = 12, Letm1 KD = 19.) ââââP < 0.0001, âââP < 0.001, âP < 0.05, n.s., not significant. Scalebar is 250 μm. Image published in: Mills A et al. (2019) Copyright © 2019 Mills, Bearce, Cella, Kim, Selig, Lee and Lowery. Creative Commons Attribution license
Image source: Published
Larger Image Printer Friendly View |