XB-IMG-176585
Xenbase Image ID: 176585
|
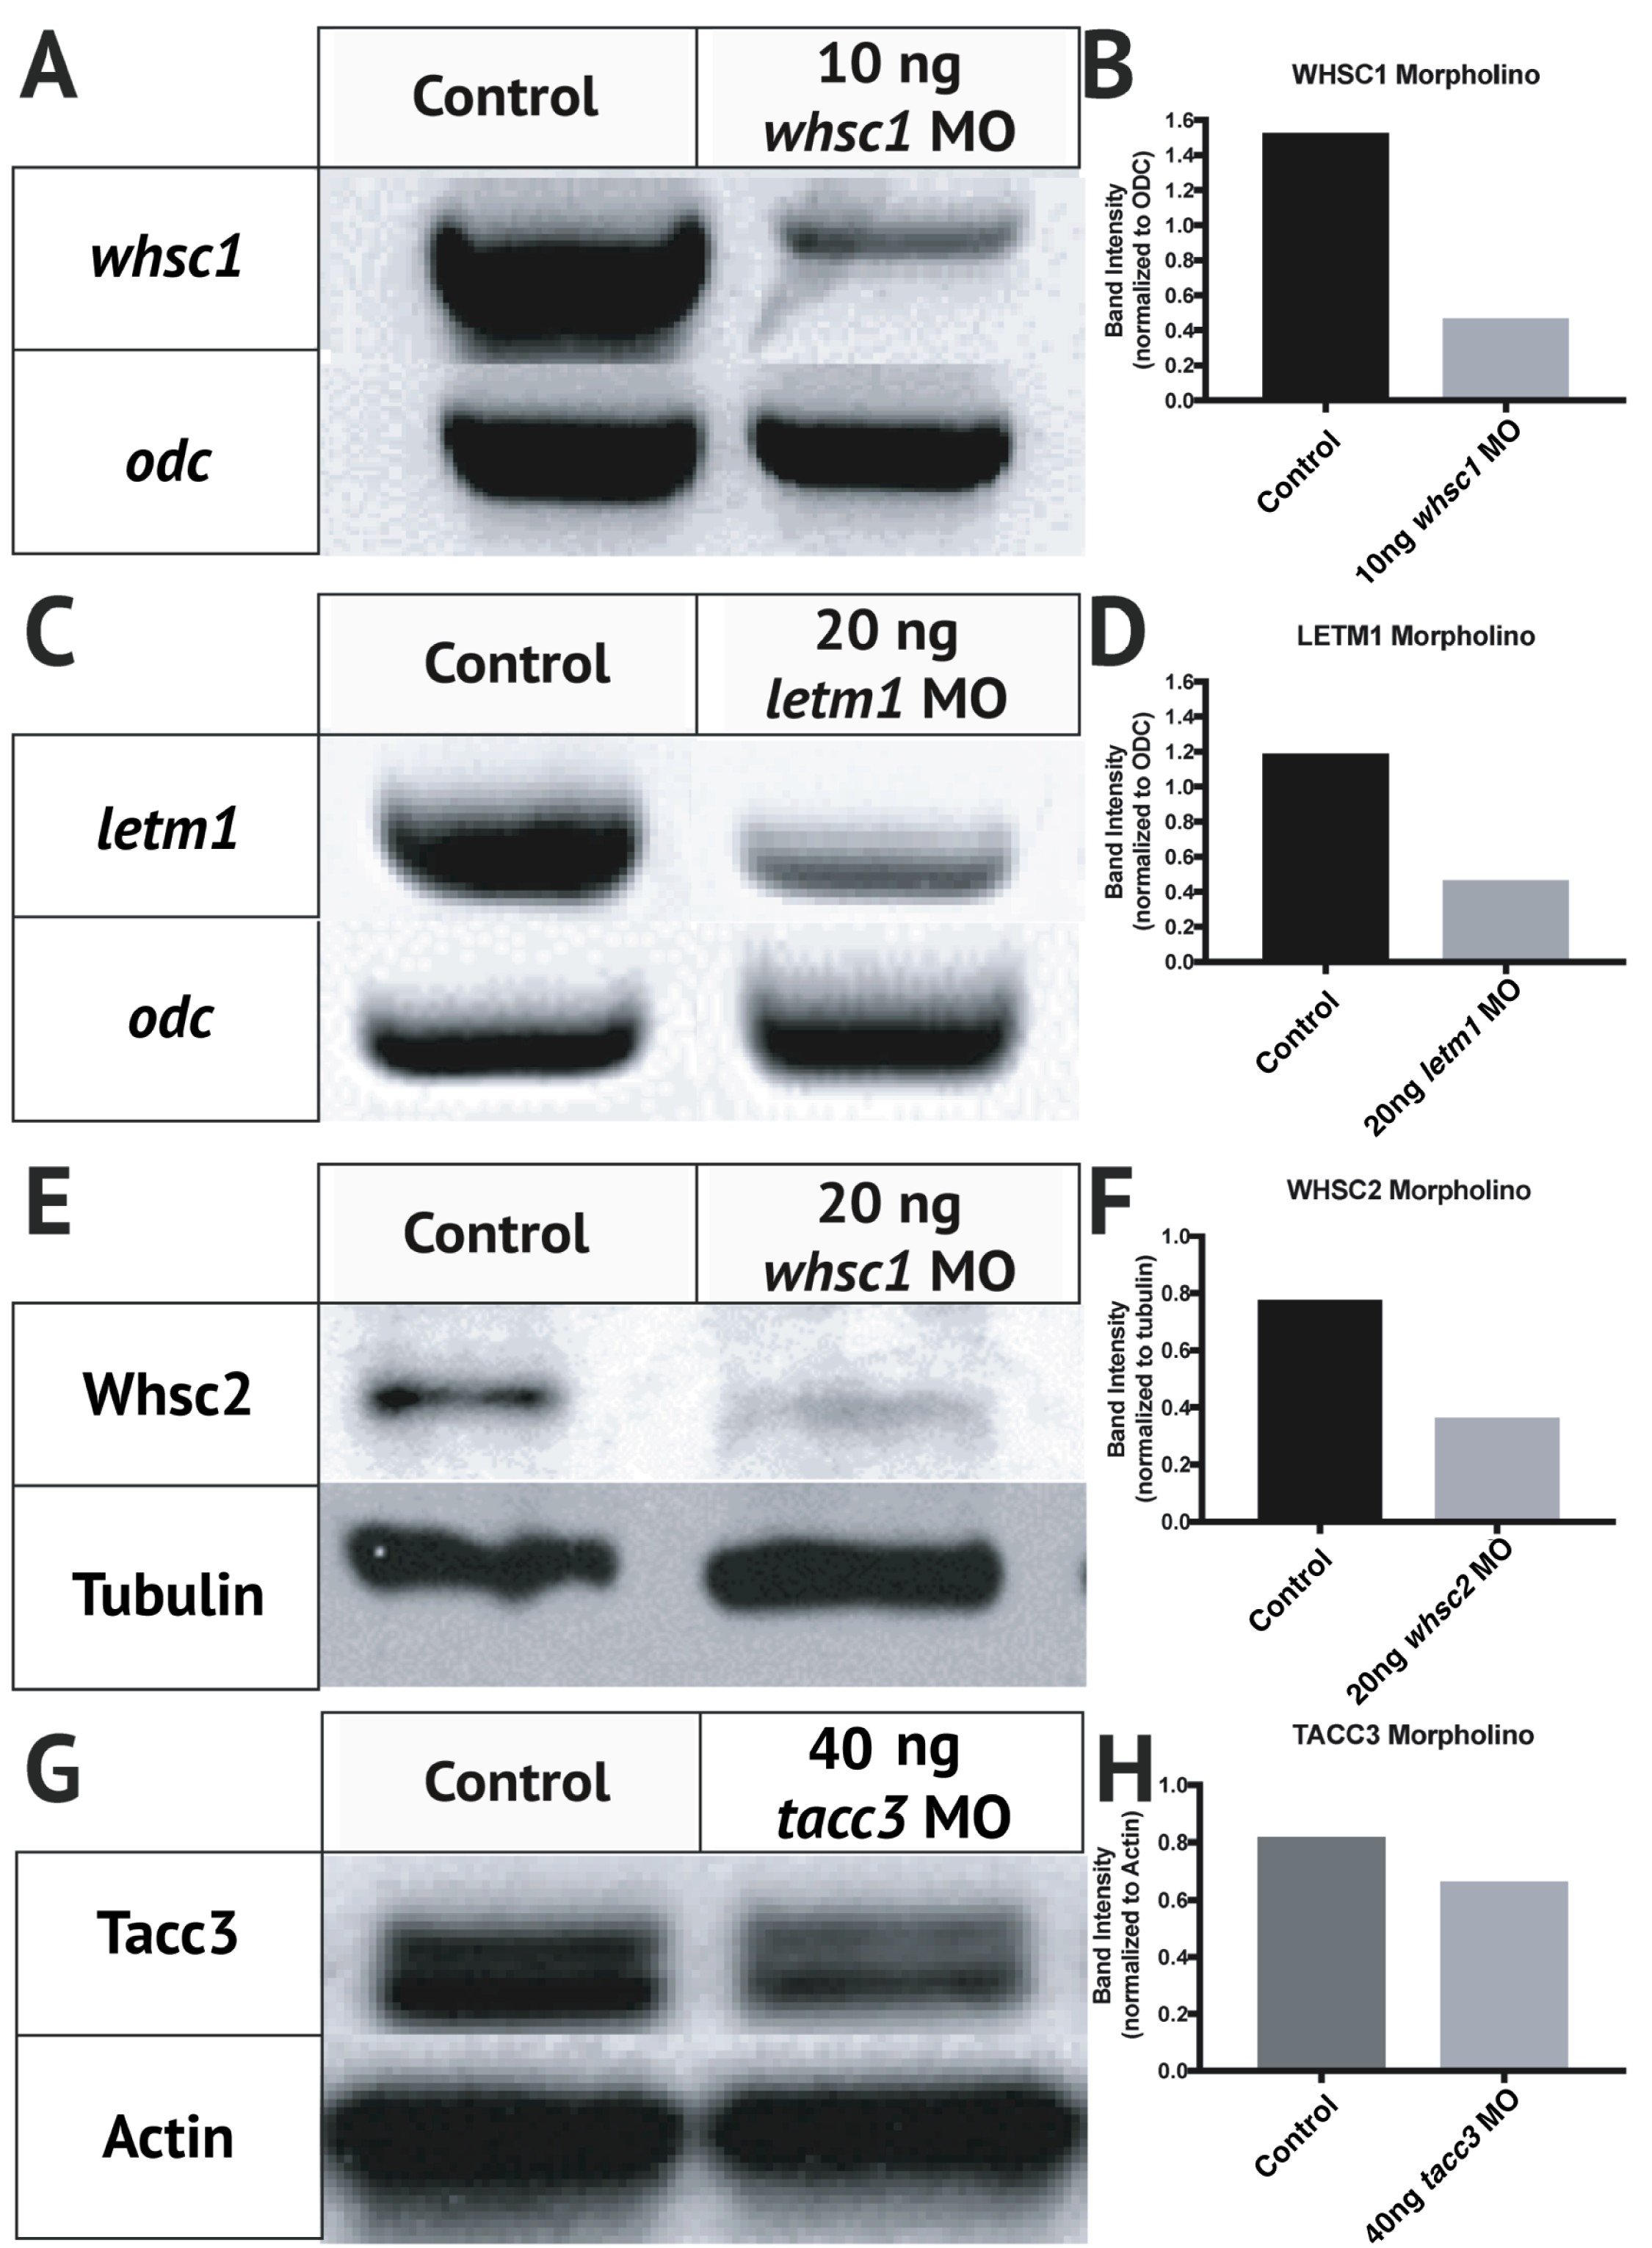
FIGURE S2 | Validation of WHS related MOs. (A,B) Gel of polymerase chain reaction (PCR) that shows injection of 10 ng MO targeted to whsc1 mRNA causes a greater than 80% reduction at 2 dpf. (C,D) Injection of 20 ng of a MO targeted against letm1 causes an 55% decrease in letm1 mRNA 2 dpf. (E,F) Western blot showing 10 ng injection of a MO targeted against whsc2 results in a greater than 50% reduction in Whsc2 protein by 2 dpf. (G,H) Western blot showing 40 ng of a MO targeted against tacc3 results in 22% reduction. Bar graphs (B,D,F,H) depict densitometry of gels (A,C) or blot (E,G) shown, but is consistent across triplicate results. Image published in: Mills A et al. (2019) Copyright © 2019 Mills, Bearce, Cella, Kim, Selig, Lee and Lowery. Creative Commons Attribution license Larger Image Printer Friendly View |