XB-IMG-177022
Xenbase Image ID: 177022
|
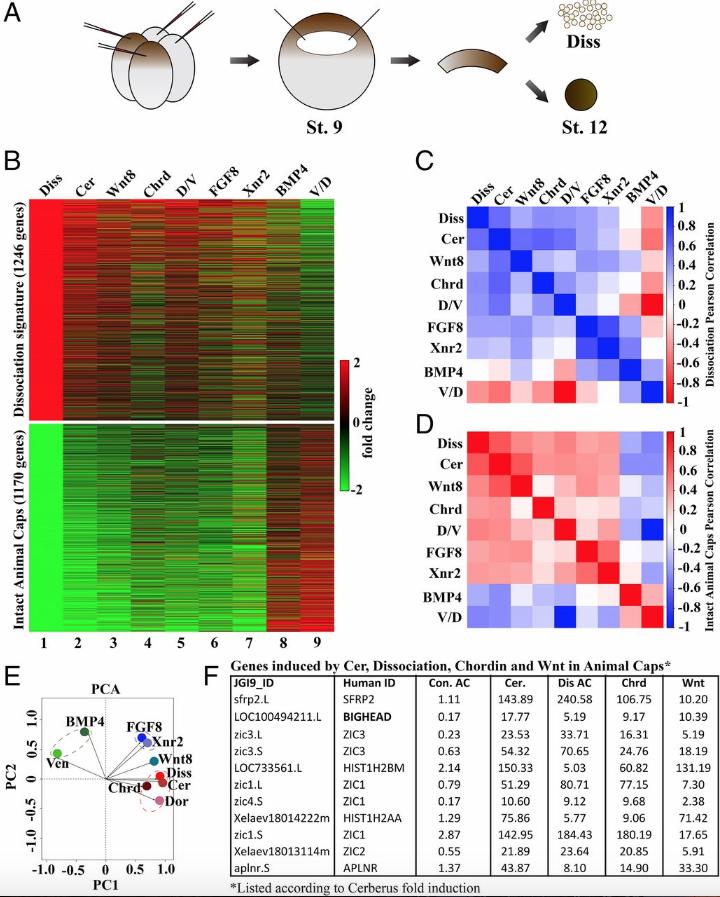
Fig 1
Transcriptome analysis of stage 12 animal cap explants. (A) Illustration of mRNA injection four-cell and animal cap excision at stage (St.) 9. Animal caps were cultured until St. 12 and collected for RNA-seq with or without cell dissociation (Diss). (B) Heat map showing fold changes of the cell dissociation and atypical epidermis signatures. Atypical epidermis corresponds to uninjected animal caps cut at stage 9 and cultured until stage 12; these controls and the dissociated cells correspond to experiment 1 shown in Dataset S1 and are from the same experiment. These gene signatures were also compared with Cerberus, Wnt8, Chordin, FGF8, or BMP4 mRNA-injected animal caps, or with D/V half-embryos derived from the same clutch of embryos. V/D, ventral/dorsal. Rows and columns were left unclustered. Note that many genes induced by dissociation were induced in all conditions, except for BMP4 mRNA-injected animal caps and ventral halves. Genes in the atypical epidermis signature were only induced by BMP4 injection and in ventral halves. A correlation matrix of the animal cap dissociation (C) and atypical epidermis signatures in the RNA-seq libraries (D) are shown. Correlation scores were calculated as Pearson correlation coefficients and color-coded as shown in the scale bar on the right of the panel. These results show that the animal cap signatures obtained via RNA-seq readily distinguish neural- and epidermal-inducing conditions. (E) Dissociation signature examined via PCA to analyze dimensionality in nine experimental conditions (BMP/con AC, Ven/Dor, FGF8/con AC, Xnr2/con AC, Wnt8/con AC, Cer/con AC, Diss/con, Dor/Ven, and Chrd/con AC). AC, animal cap; con, control; Dor, dorsal; Ven, ventral. Each axis represents a principal component (PC1 and PC2), with the first one showing the most variation. PCA clustered epidermal-forming conditions (Ven and BMP), neural-inducing conditions (Diss, Cer, Chrd, and D/V), and mesoderm-forming conditions (FGF8 and Xnr2) without systemic bias. Note that epidermal and dissociation conditions lie on opposing quadrants, indicating the greatest differences. (F) Table of genes induced by Cer mRNA, dissociation, Chrd mRNA, and Wnt mRNA in animal caps listed according to Cerberus fold induction. Because Bighead was induced in all neuralizing conditions and ranked second in the list, it was chosen for further analysis. Image published in: Ding Y et al. (2018) Copyright © 2018 the Author(s). This image is reproduced with permission of the journal and the copyright holder. This is an open-access article distributed under the terms of the Creative Commons Attribution-NonCommercial-NoDerivatives license Larger Image Printer Friendly View |