XB-IMG-1800
Xenbase Image ID: 1800
|
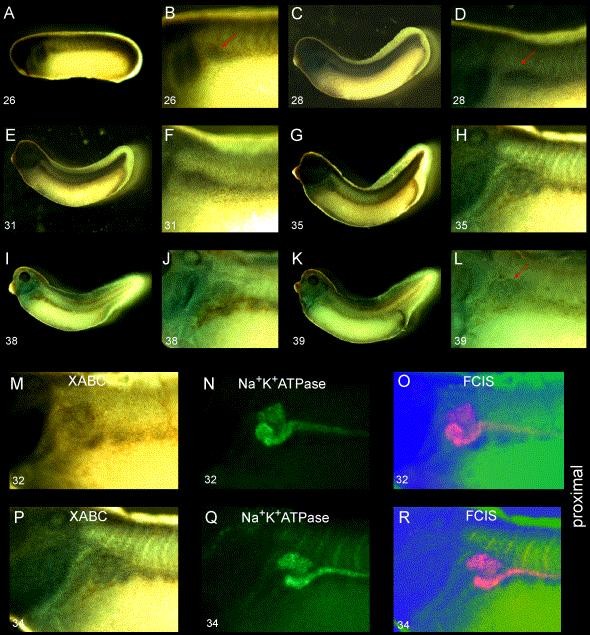
Fig. 6. Pronephric expression of an ABC transporter. Embryo stages are shown on the lower left of each panel. XABC expression in the pronephros is first detected at stage 26 (A and B), red arrow. The XABC1 gene is expressed in both early and late proximal segments (AâL). Other expressing tissues include the somites, brachial arches, and head. By stage 35, expression of XABC in nonpronephric tissues increases, necessitating shorter development times, hence the relatively weak signal in later panels. Panels MâR illustrates FCIS staining. Purple development of the transporter is shown in the left column, FITC-tyramide development of the Na+K+ATPase counterstain shown in the middle, and FCIS overlay shown on the right. Image published in: Zhou X and Vize PD (2004) Copyright © 2004. Image reproduced with permission of the Publisher, Elsevier B. V.
Image source: Published Larger Image Printer Friendly View |