XB-IMG-37776
Xenbase Image ID: 37776
|
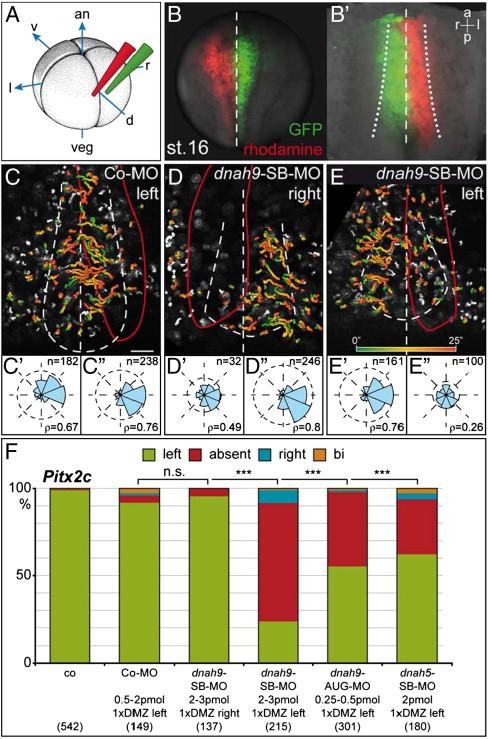
Fig. 6. Flow is dispensable on the right side of the GRP. (A, B) Injection scheme to specifically target left and right half of floor plate (B, external view) and GRP (Bâ, ventral view of dorsal explant). (CâE) Flow analysis of Co-MO left (C), and dnah9-SB-MO right (D) and left (E) injected dorsal explants (ventral views, anterior up). Targeted areas indicated by red lines represent the limits of lineage tracer. Particle movements displayed as gradient-time trails (GTTs), representing 25 s from green to red (cf. bar in panel E). Note that flow was absent on dnah9-SB-targeted sides. (CââEâ) Quantitative analysis of GTT directionality over the respective left and right sides of the GRP. (F) Pitx2c expression analysis. Wildtype left-asymmetric expression in Co-MO and right dnah9-SB-MO-injected tadpoles, and absence of signals in left dnah9-SB-MO, dnah9-AUG-MO and dnah5-SB-MO-injected embryos. a, anterior; an, animal; d, dorsal; l, left; p, posterior; r, right; v, ventral; veg, vegetal. Scale bar in panel C represents 50 μm and applies to panels CâE. Image published in: Vick P et al. (2009) Copyright © 2009. Image reproduced with permission of the Publisher, Elsevier B. V. Larger Image Printer Friendly View |