XB-IMG-45777
Xenbase Image ID: 45777
|
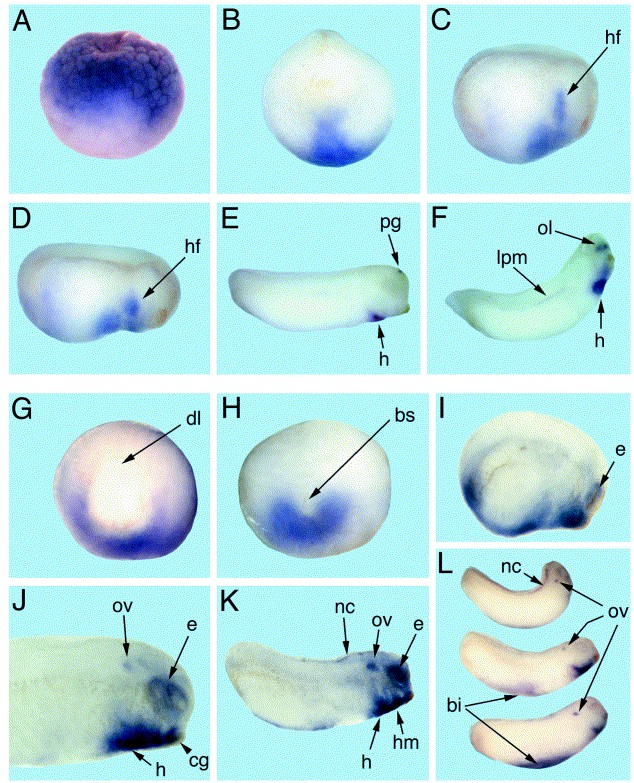
Fig. 3. Spatial distribution of BMP-2 and BMP-4 transcripts during embryogenesis. The spatial expression of X. tropicalis BMP-2 (AâF) and BMP-4 genes (GâL) was analysed by whole mount in situ hybridization (Harland, 1991). Digoxygenin-labelled antisense probes were derived from the translated regions of exon III, generated by PCR and subcloned into pSPT 18 (Roche). (A) morula, (B) neurula (anterior view), (C) end of neurulation, (D,E) early and late organogenesis, respectively, (F) hatching embryo, (G) midgastrula (vegetal view), (H) early neurula (posterior view), (I) end of neurulation, (J,K) early and (L) late organogenesis stages, respectively. Embryos shown in (CâF) and (IâL) are positioned with anterior to the right and posterior to the left side. All embryos have been de-pigmented in 10% H2O2/methanol and embryos shown in (IâK) are cleared in benzylbenzoate. bs, blastoporal slit; cg, cement gland; dl, dorsal lip; e, eye; h, heart; hf, heart field; hm, head mesenchyme; lpm, lateral plate mesoderm; nc, neural crest; ol, olfactory placodes; ov, otic vesicle; pg, pineal gland. Image published in: Knöchel S et al. (2001) Copyright © 2001. Image reproduced with permission of the Publisher, Elsevier B. V.
Image source: Published Larger Image Printer Friendly View |