XB-IMG-49184
Xenbase Image ID: 49184
|
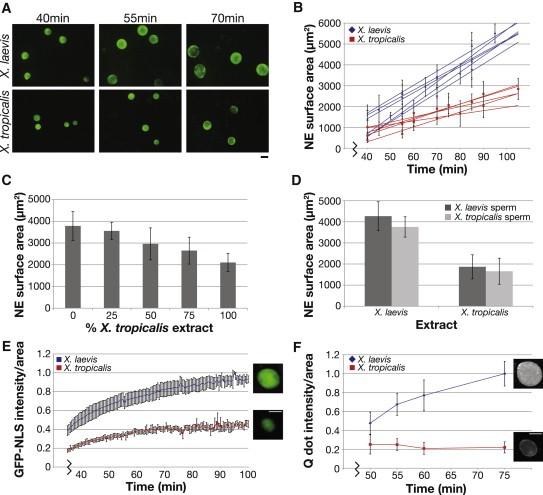
Figure 1. Nuclear Size and Import Scale between X. laevis and X. tropicalis(A) Nuclei were assembled in X. laevis or X. tropicalis egg extract with X. laevis sperm and visualized by immunofluorescence using mAb414 that recognizes the NPC. Scale bar, 20 μm.(B) NE surface area was quantified from images like those in (A) for at least 50 nuclei at each time point. Best-fit linear regression lines are displayed for six X. laevis and five X. tropicalis egg extracts, and the average difference between the two extracts was statistically significant by Student's t test (p < 0.001). R2 values range from 0.96 to 0.99 for X. laevis and 0.94 to 0.98 for X. tropicalis. Error bars represent standard deviation (SD).(C) X. laevis and X. tropicalis extracts were mixed as indicated, and nuclear size was measured at 90 min. One representative experiment of three is shown, and error bars represent SD.(D) Nuclei were assembled using the indicated source of extract and sperm, and nuclear size was measured at 90 min. One representative experiment of three is shown, and error bars represent SD.(E) GFP-NLS was added to nuclei at 30 min, and images were acquired live at 30 s intervals with the same exposure time. Nuclear GFP-NLS fluorescence intensity per unit area was measured at each time point, averaged for five nuclei from each extract, and normalized to 1.0 (arbitrary units). Error bars represent SD. Representative images are at 70 min. Scale bar, 20 μm.(F) IBB-coated Qdots were added to nuclei at 30 min, and images were acquired live at the indicated time points for at least 30 nuclei with the same exposure time. Nuclear Qdot fluorescence intensity per unit area was calculated, averaged, and normalized to 1.0 (arbitrary units). Error bars represent SD. One representative experiment of three is shown. Representative images are at 75 min. Scale bar, 20 μm.See also Figure S1 and Movie S1. Image published in: Levy DL and Heald R (2010) Copyright © 2010. Image reproduced with permission of the Publisher, Elsevier B. V. Larger Image Printer Friendly View |