XB-IMG-74405
Xenbase Image ID: 74405
|
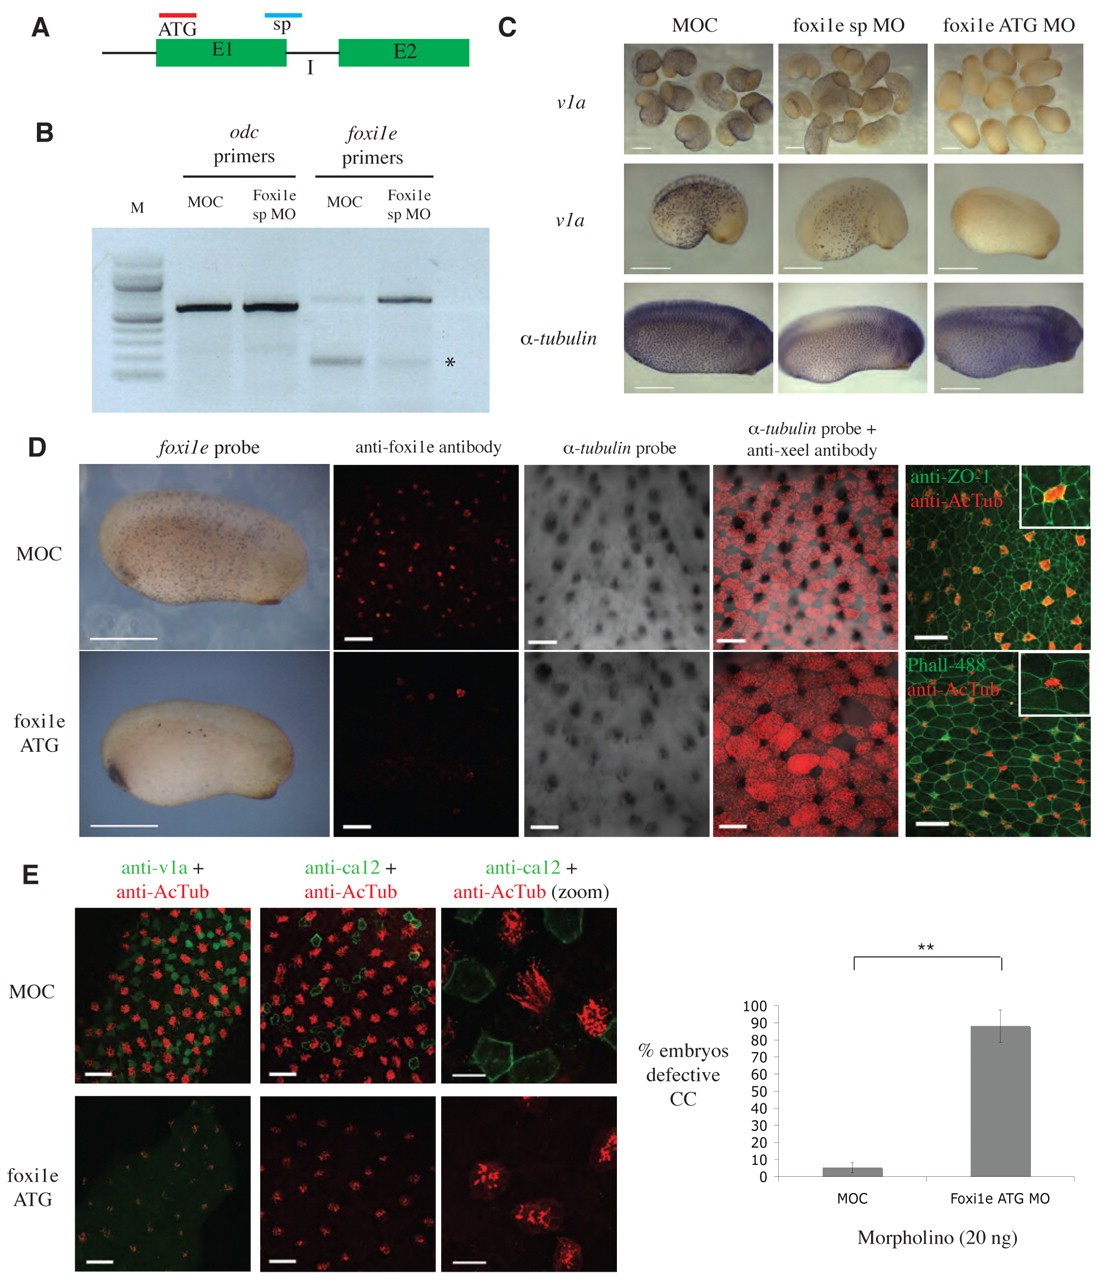
Fig. 6. Impact of foxi1e knockdown on the mucociliary epidermis. (A) Diagrammatic representation of foxi1e, showing the position of the ATG MO (red) and sp MO (blue). E1, exon 1; E2, exon 2; I, intron. (B) Reverse transcriptase (RT)-PCR with ornithine decarboxylase (odc) control and foxi1e primers, showing that abnormal splicing of foxi1e is observed when a foxi1e sp MO is injected. Asterisk marks reduction in foxi1e splice product in foxi1e splice morphants compared with control. (C) Injection of foxi1e sp MO reduces (11/11) and injection of foxi1e ATG MO abolishes (11/11) the expression of v1a, whereas MOC has no effect (0/9) at early tadpole stage as shown by whole-mount in situ hybridisation. Neither foxi1e sp MO (0/13), foxi1e ATG MO (0/11) or MOC (0/10) had an effect on expression of the ciliated cell marker α-1-tubulin. Scale bars: 500 μm. (D) Embryos were injected with MOC or foxi1e ATG MO (20 ng each) and analysed as indicated. In situ hybridisation with foxi1e probe shows that the spotted expression of foxi1e is reduced (9/9) in foxi1e morphants, whereas MOC has no effect (0/11). Scale bars: 500 μm. Immunostaining of tadpole epidermis with anti-foxi1e antibody shows that the protein expression is reduced in foxi1e morphants (11/12) but not in the MOC controls (0/10). In situ hybridisation with α-1-tubulin probe (black), combined with anti-xeel antibody staining (red), as indicated, reveals that, in the foxi1e morphants, the number of cells that are not positive for either α-1-tubulin or xeel is greatly reduced compared with controls. This suggests that the missing cells are ionocytes. Actin staining (phalloidinâAlexa-Fluor-488; green) combined with anti-acetylated α-tubulin antibody (red) reveals that epidermal cells are arranged in a rosette pattern around each ciliated cell in the foxi1e-ATG-MO-injected epidermis, but in the MOC control (stained with anti-ZO-1 and acetylated α-tubulin), this rosette formation is broken by the insertion of ionocytes (inset shows higher-magnification view). See text for details. Scale bars: 50 μm. (E) Immunostaining for v1a (green), ca12 (green) and acetylated α-tubulin (red) in the combinations indicated confirms that ionocyte markers are missing in foxi1e-ATG-MO-injected embryos (34/35; n=5 experiments) but not in MOC controls (0/35; n=5 experiments). Scale bars: 50 μm. High-magnification images (zoom; scale bar: 20 μm) reveal that ciliated cells are abnormal in the foxi1e morphants. Bar graph shows quantification of the experiments looking at defective ciliated cells (n=4 experiments). Defective ciliated cells were evident in the majority of foxi1e ATG morphant embryos (42/47), but not in MOC-treated embryos (2/32). **P=0.0018. Image published in: Dubaissi E and Papalopulu N (2011) © 2011. Creative Commons Attribution-NonCommercial-ShareAlike license
Image source: Published Larger Image Printer Friendly View |