XB-IMG-74407
Xenbase Image ID: 74407
|
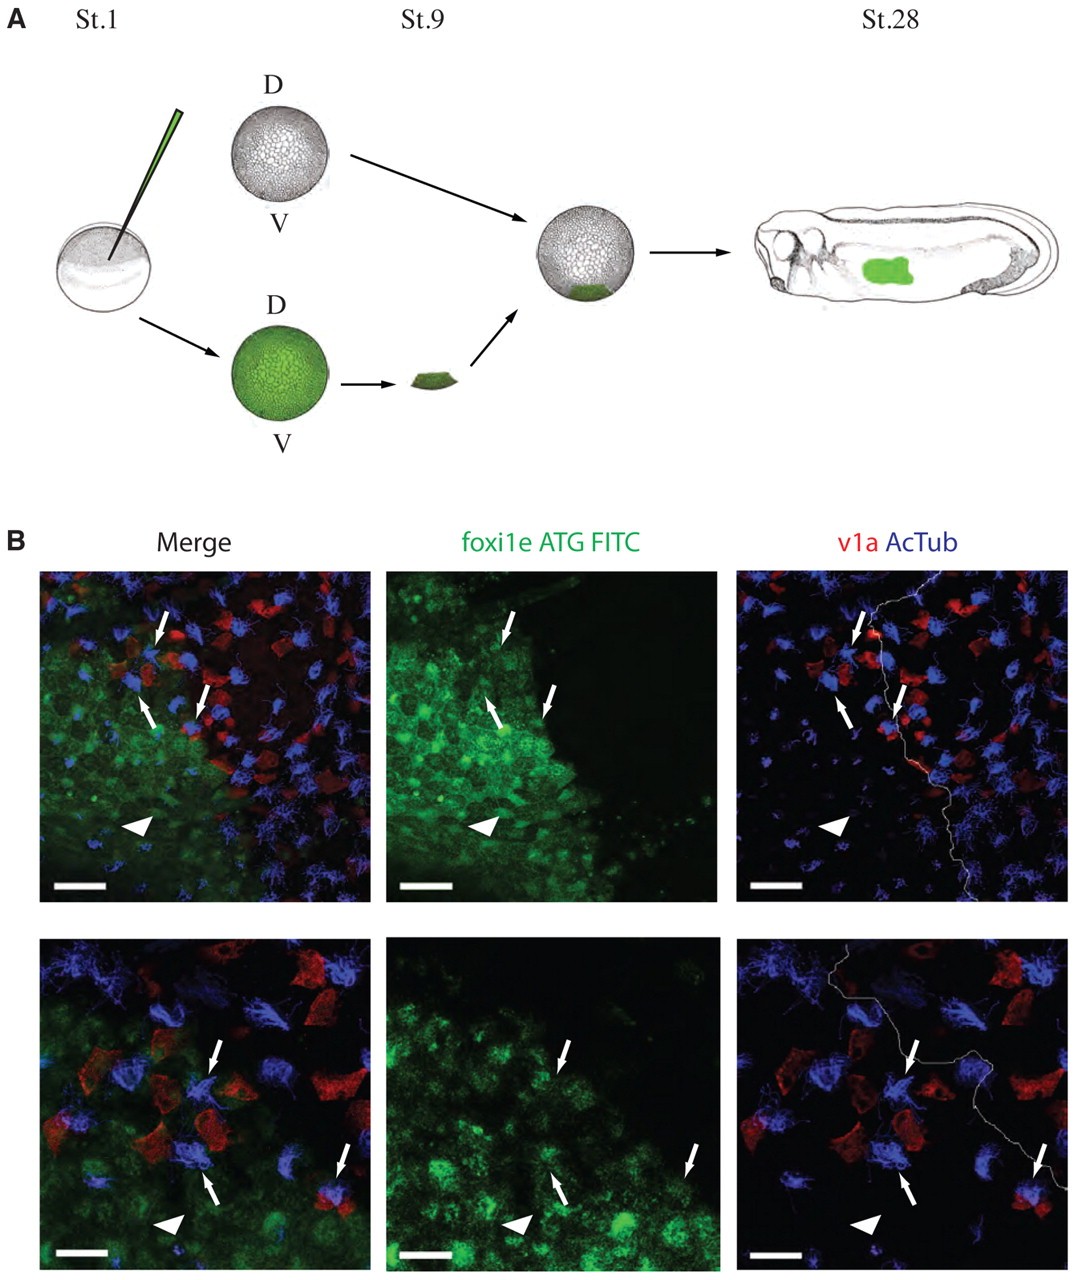
Fig. 8. Mosaic analysis confirms ciliary defects. (A) FITC-labelled foxi1e ATG MO was injected at the one-cell stage and fluorescence confirmed at stage 9. Small grafts from morphant embryos were taken from the ventral animal pole (V) at stage 9 and grafted onto the ventral animal pole of wild-type embryos. Embryos developed until stage 28, when the morphant tissue could be distinguished from wild-type tissue in the epidermis by FITC fluorescence. D, dorsal. (B) A transplanted embryo at stage 28 shows tissue injected with MO (green), v1a-expressing cells (red) and ciliated cells (blue). Lower panels show higher-magnification images of the upper panels. Defective ciliated cells (arrowheads) are evident within the transplanted region, but ciliated cells (arrows) at the border of the transplanted tissue and adjacent to ionocytes seem normal. Note that the highlighted ciliated cells (arrows) at the border are green owing to the presence of the MO in these cells and yet the cilia appear normal. The white line in the v1A/AcTub images highlights the border between morphant and wild-type tissue. Scale bars: 50 μm (upper panels); 25 μm (lower panels). Image published in: Dubaissi E and Papalopulu N (2011) © 2011. Creative Commons Attribution-NonCommercial-ShareAlike license Larger Image Printer Friendly View |