XB-IMG-75339
Xenbase Image ID: 75339
|
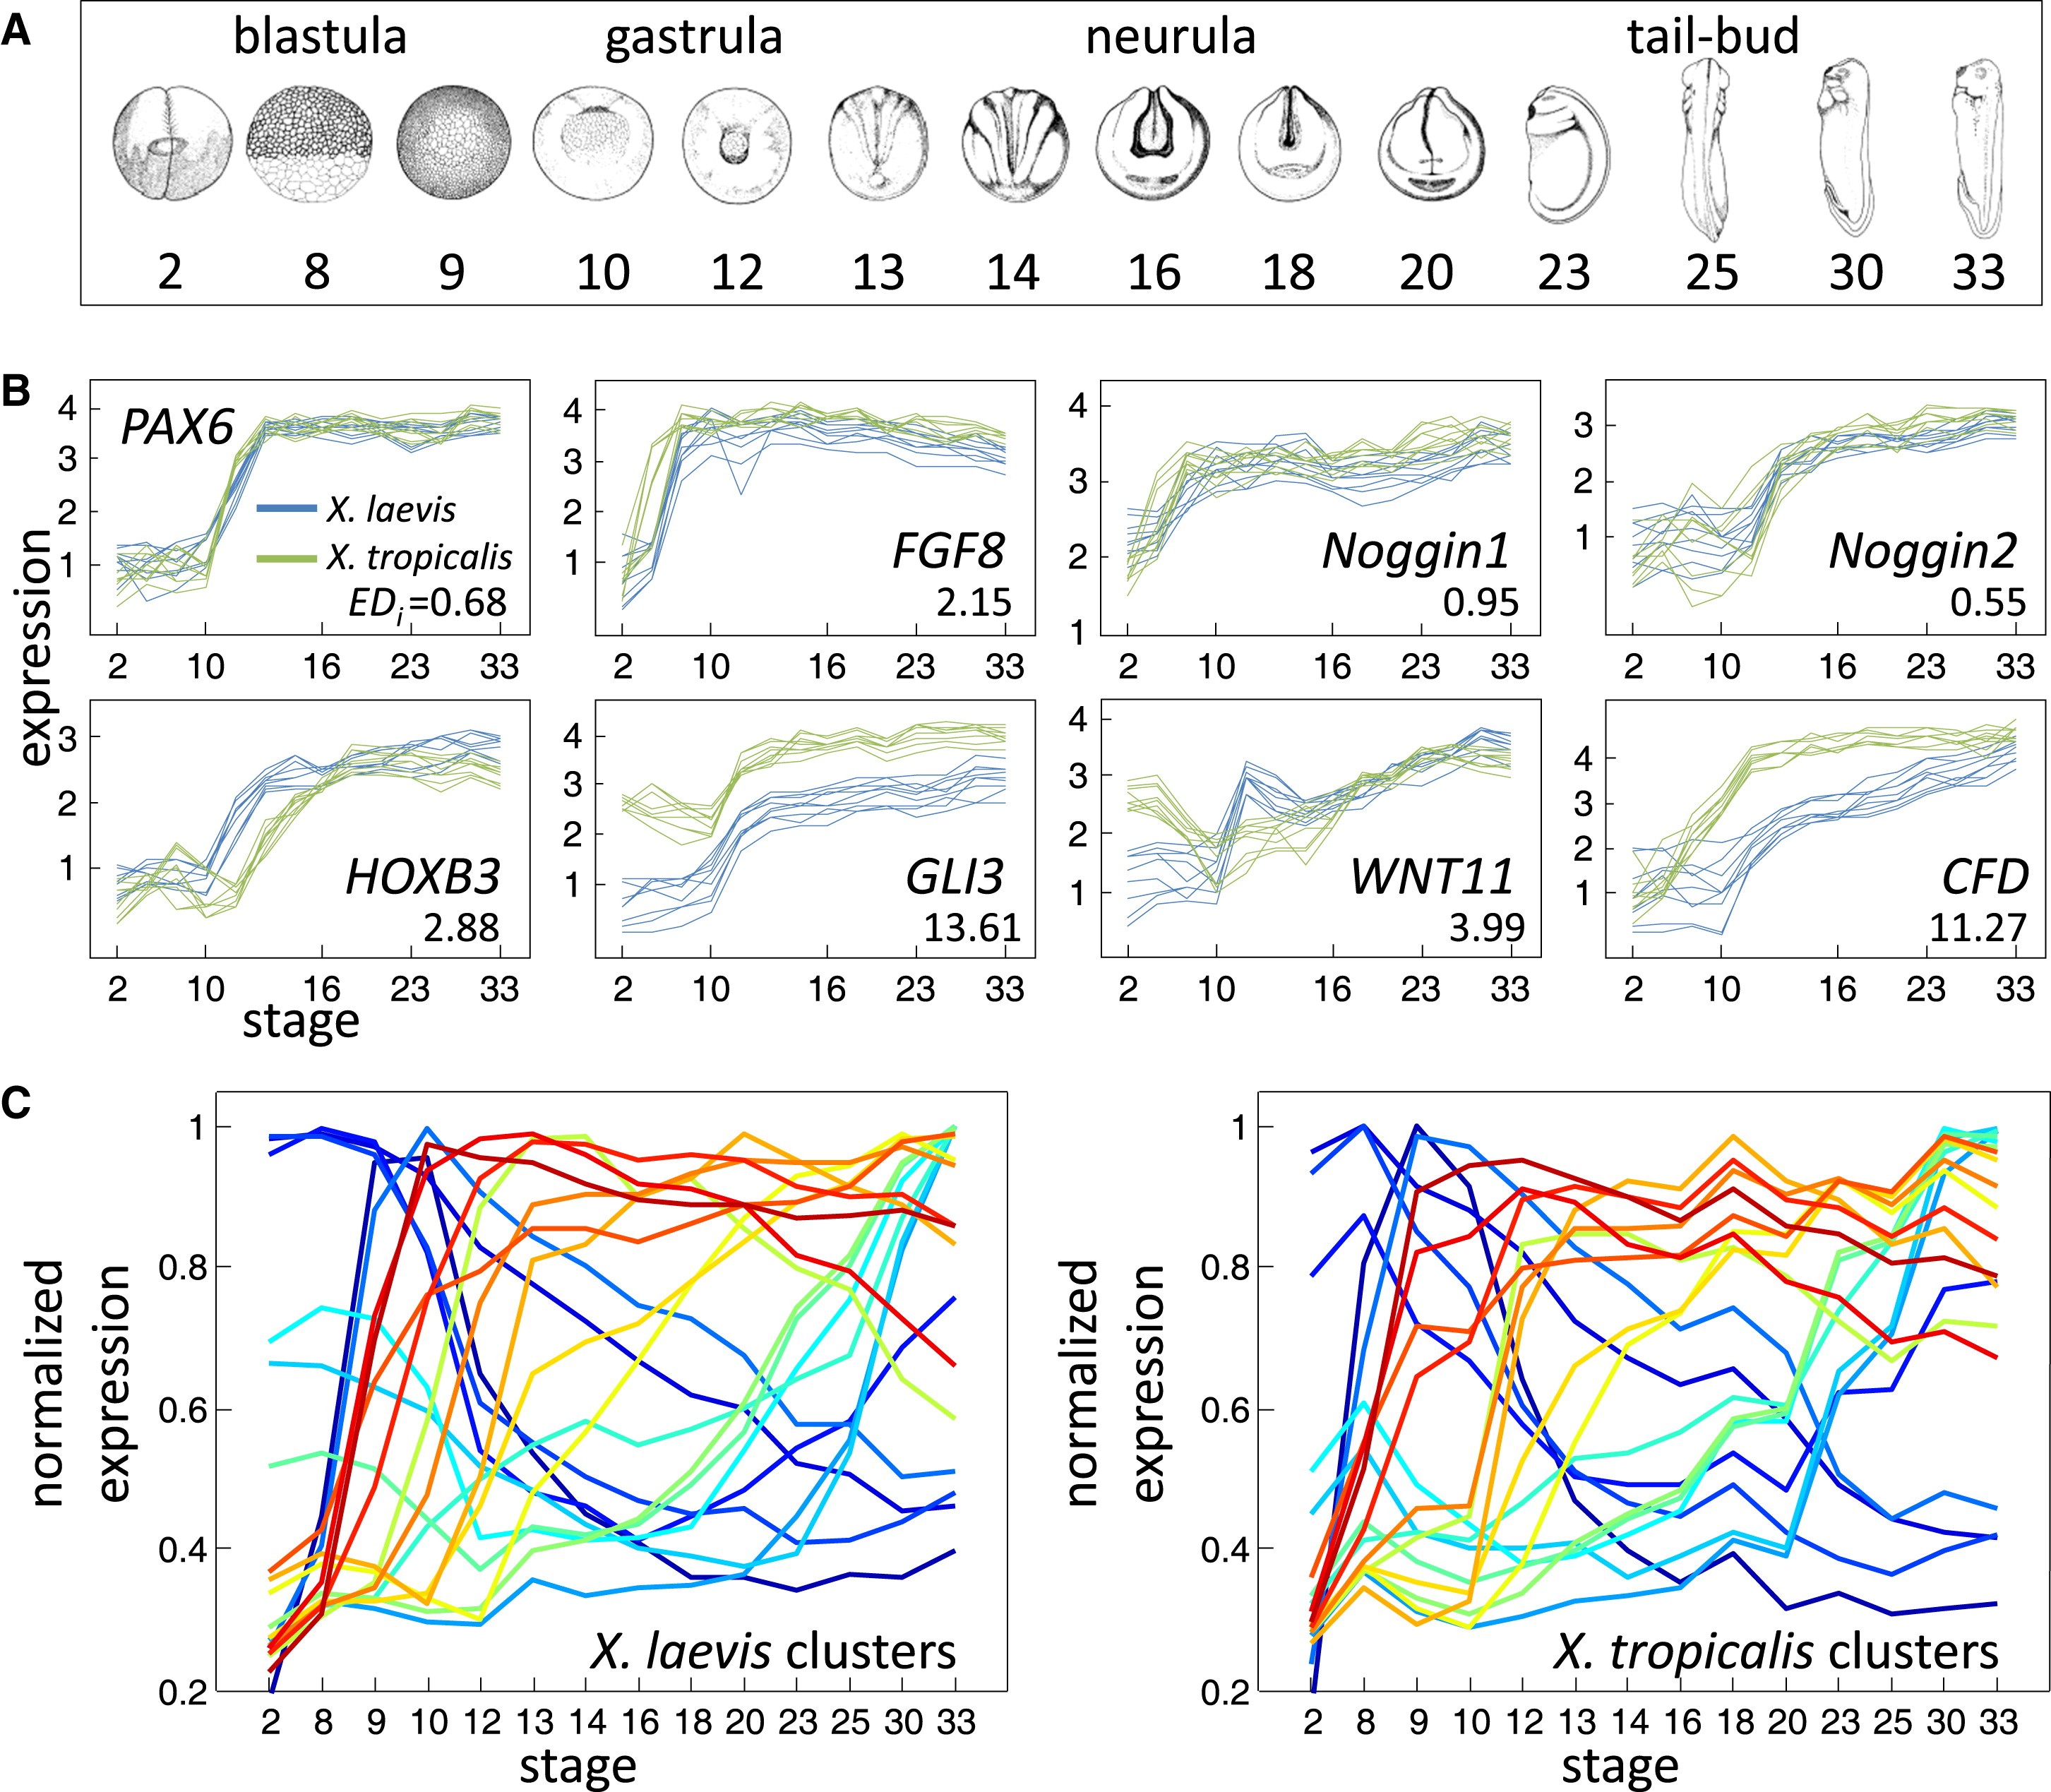
Figure 1. Comparative Transcriptomics of Xenopus Development(A) Developmental stages assayed in this study, taken from Nieuwkoop and Faber (1994).(B) Microarray gene expression data for the eight indicated genes. For each gene, the nine profiles (three clutches across three probes) are shown for both X. laevis (blue) and X. tropicalis (green). The y axis indicates log10 relative concentrations of mRNA abundance (see Experimental Procedures). Also indicated for each gene is its EDi, a metric for divergence explained in the text.(C) Summary of 20 gene expression clusters for X. laevis (left). Clusters were generated using QT clustering (Heyer et al., 1999) with a maximum correlation distance of 0.85. Each summary profile is the mean of the member profiles, normalized by dividing by the maximum value. The average profile of the X. tropicalis orthologs in these same clusters are shown to the right. Orthologous clusters share the same color across plots. Image published in: Yanai I et al. (2011) Copyright © 2011. Image reproduced with permission of the Publisher, Elsevier B. V. Larger Image Printer Friendly View |