XB-IMG-75341
Xenbase Image ID: 75341
|
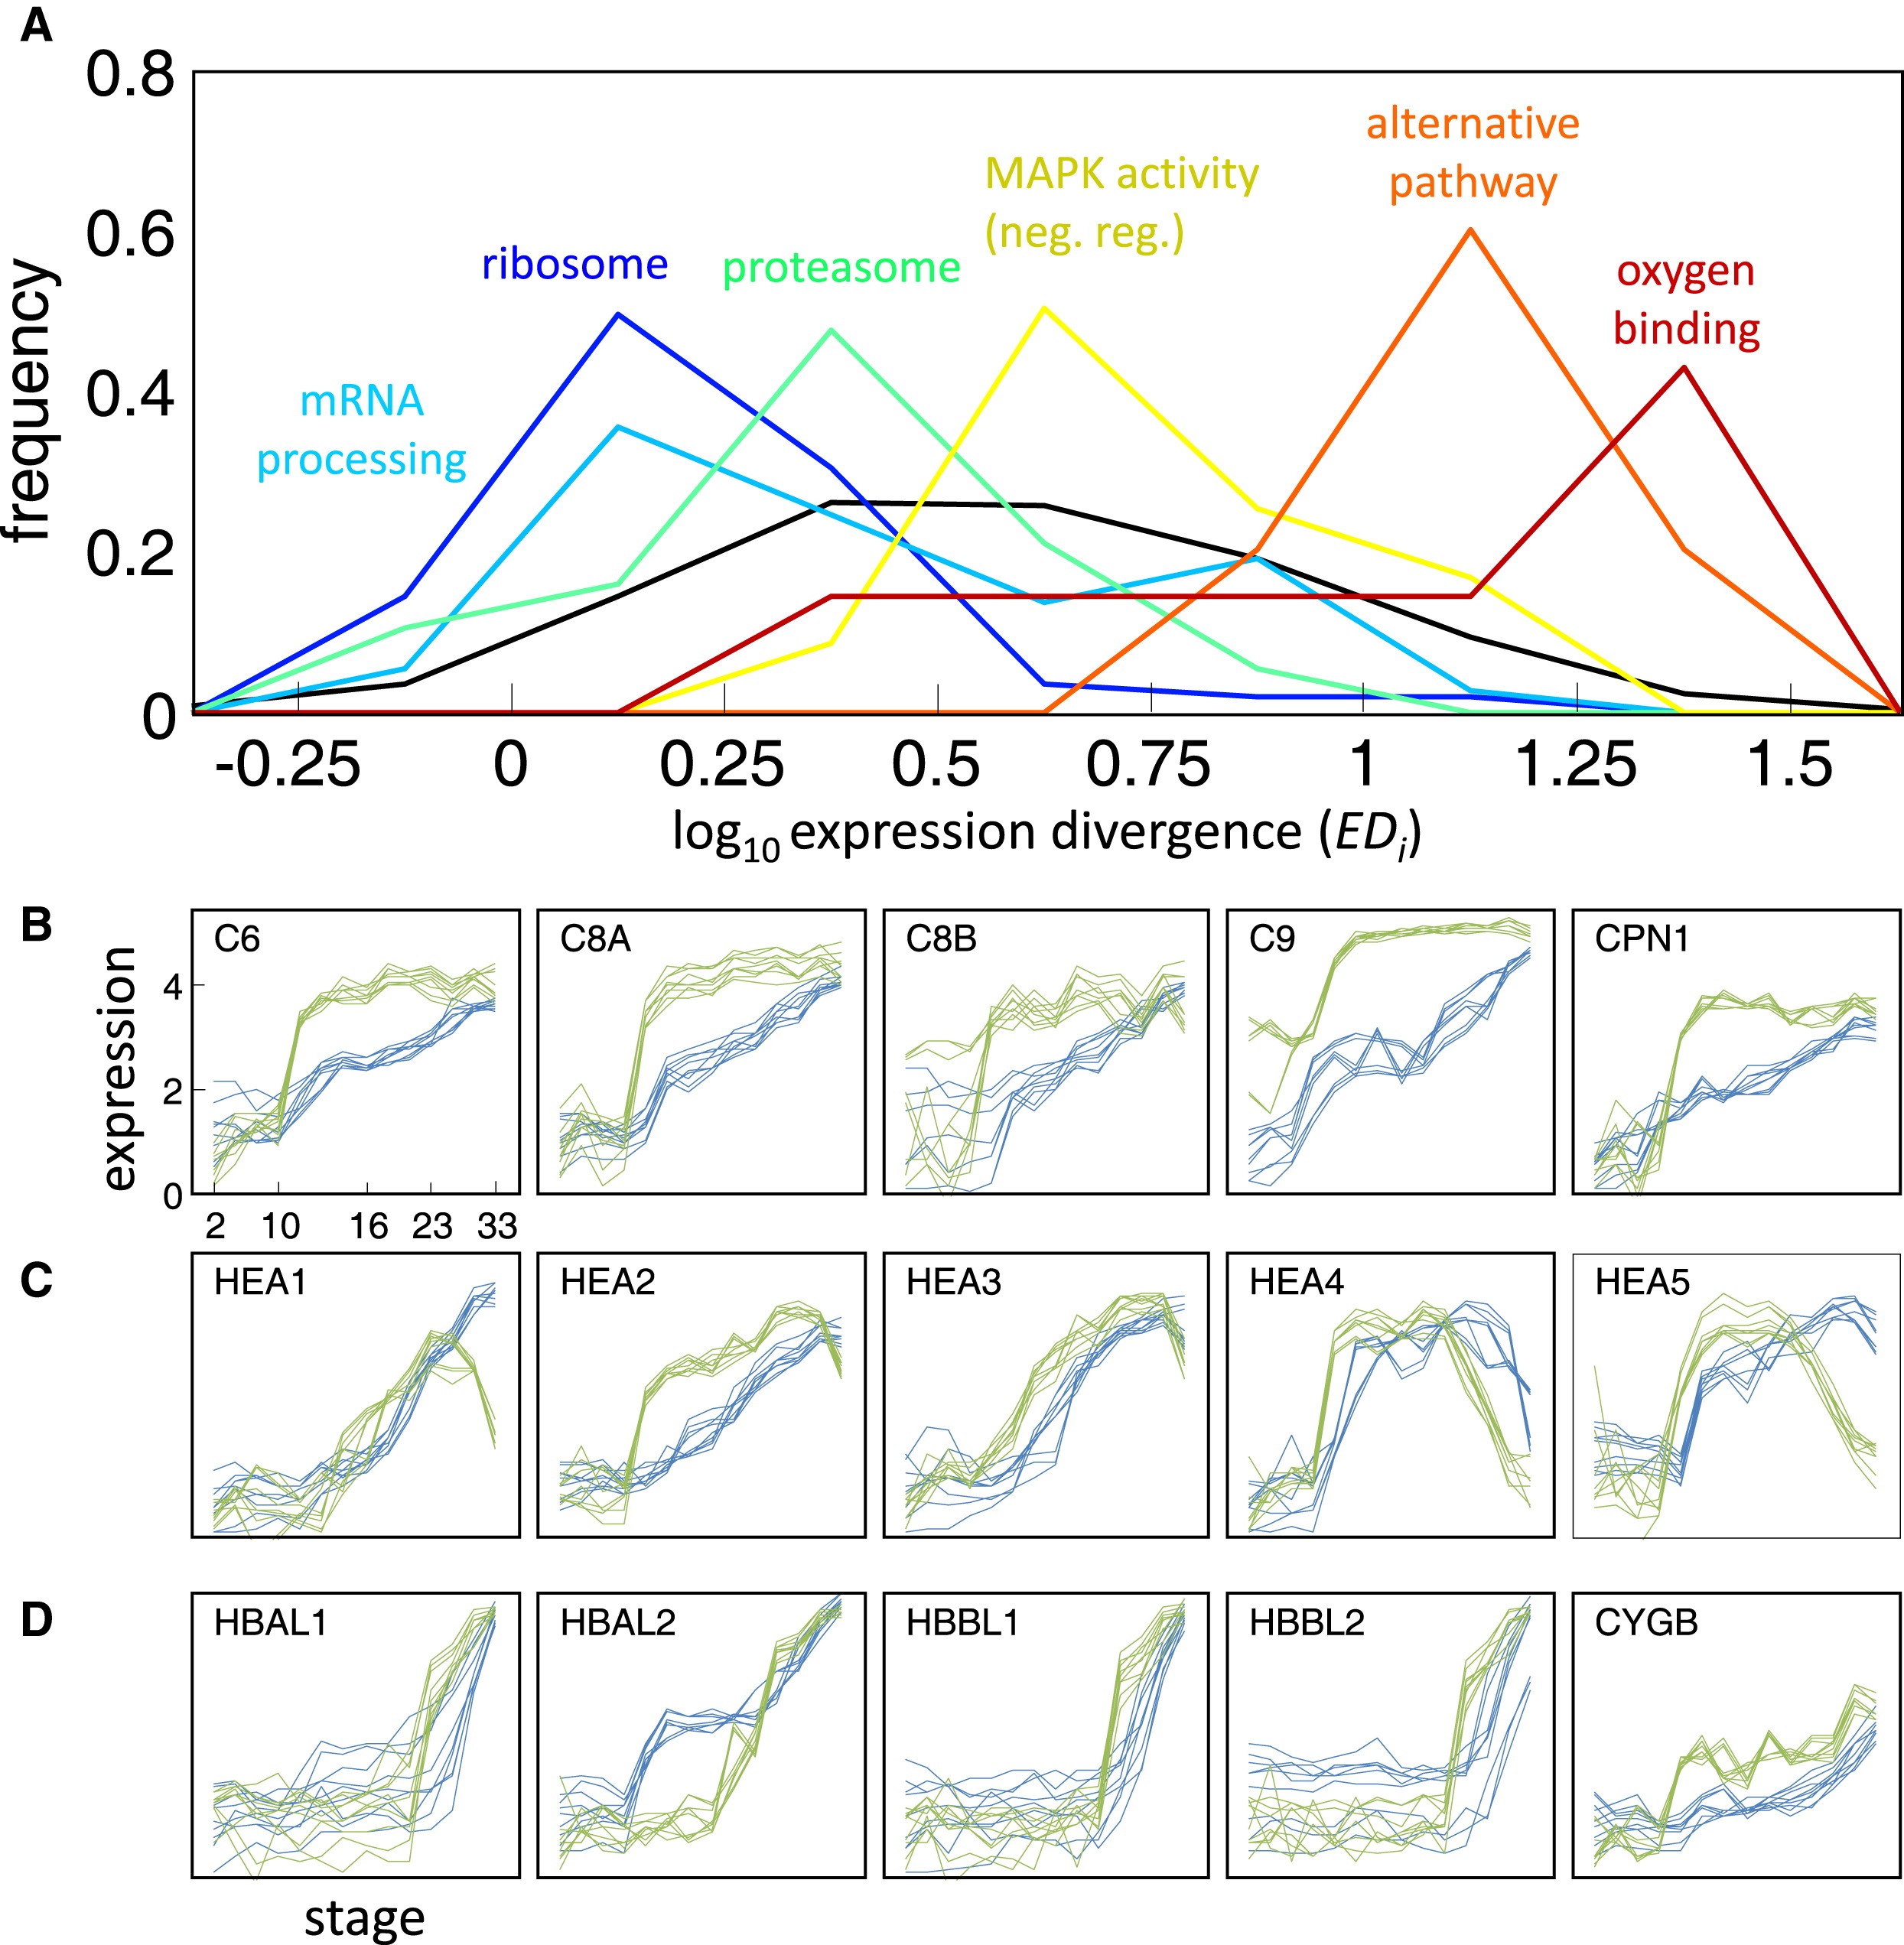
Figure 3. Conservation and Divergence across Pathways(A) Expression divergence (EDi) distributions across functional gene sets and indicated by different colors. The y axis indicates the normalized frequency. The black plot indicates the normalized distribution of divergences for all genes. A shift to the left/right indicates enrichment for conservation/divergence, respectively.(B–D) Expression profiles of genes involved in the alternative pathway of the complement system (B), hatching enzymes (C), and oxygen-binding genes (D). See Figure S3B for additional heterochrony in members of the membrane attack complex. Expression profiles are shown in log10 relative concentrations as in Figure 1. Image published in: Yanai I et al. (2011) Copyright © 2011. Image reproduced with permission of the Publisher, Elsevier B. V. Larger Image Printer Friendly View |