XB-IMG-75342
Xenbase Image ID: 75342
|
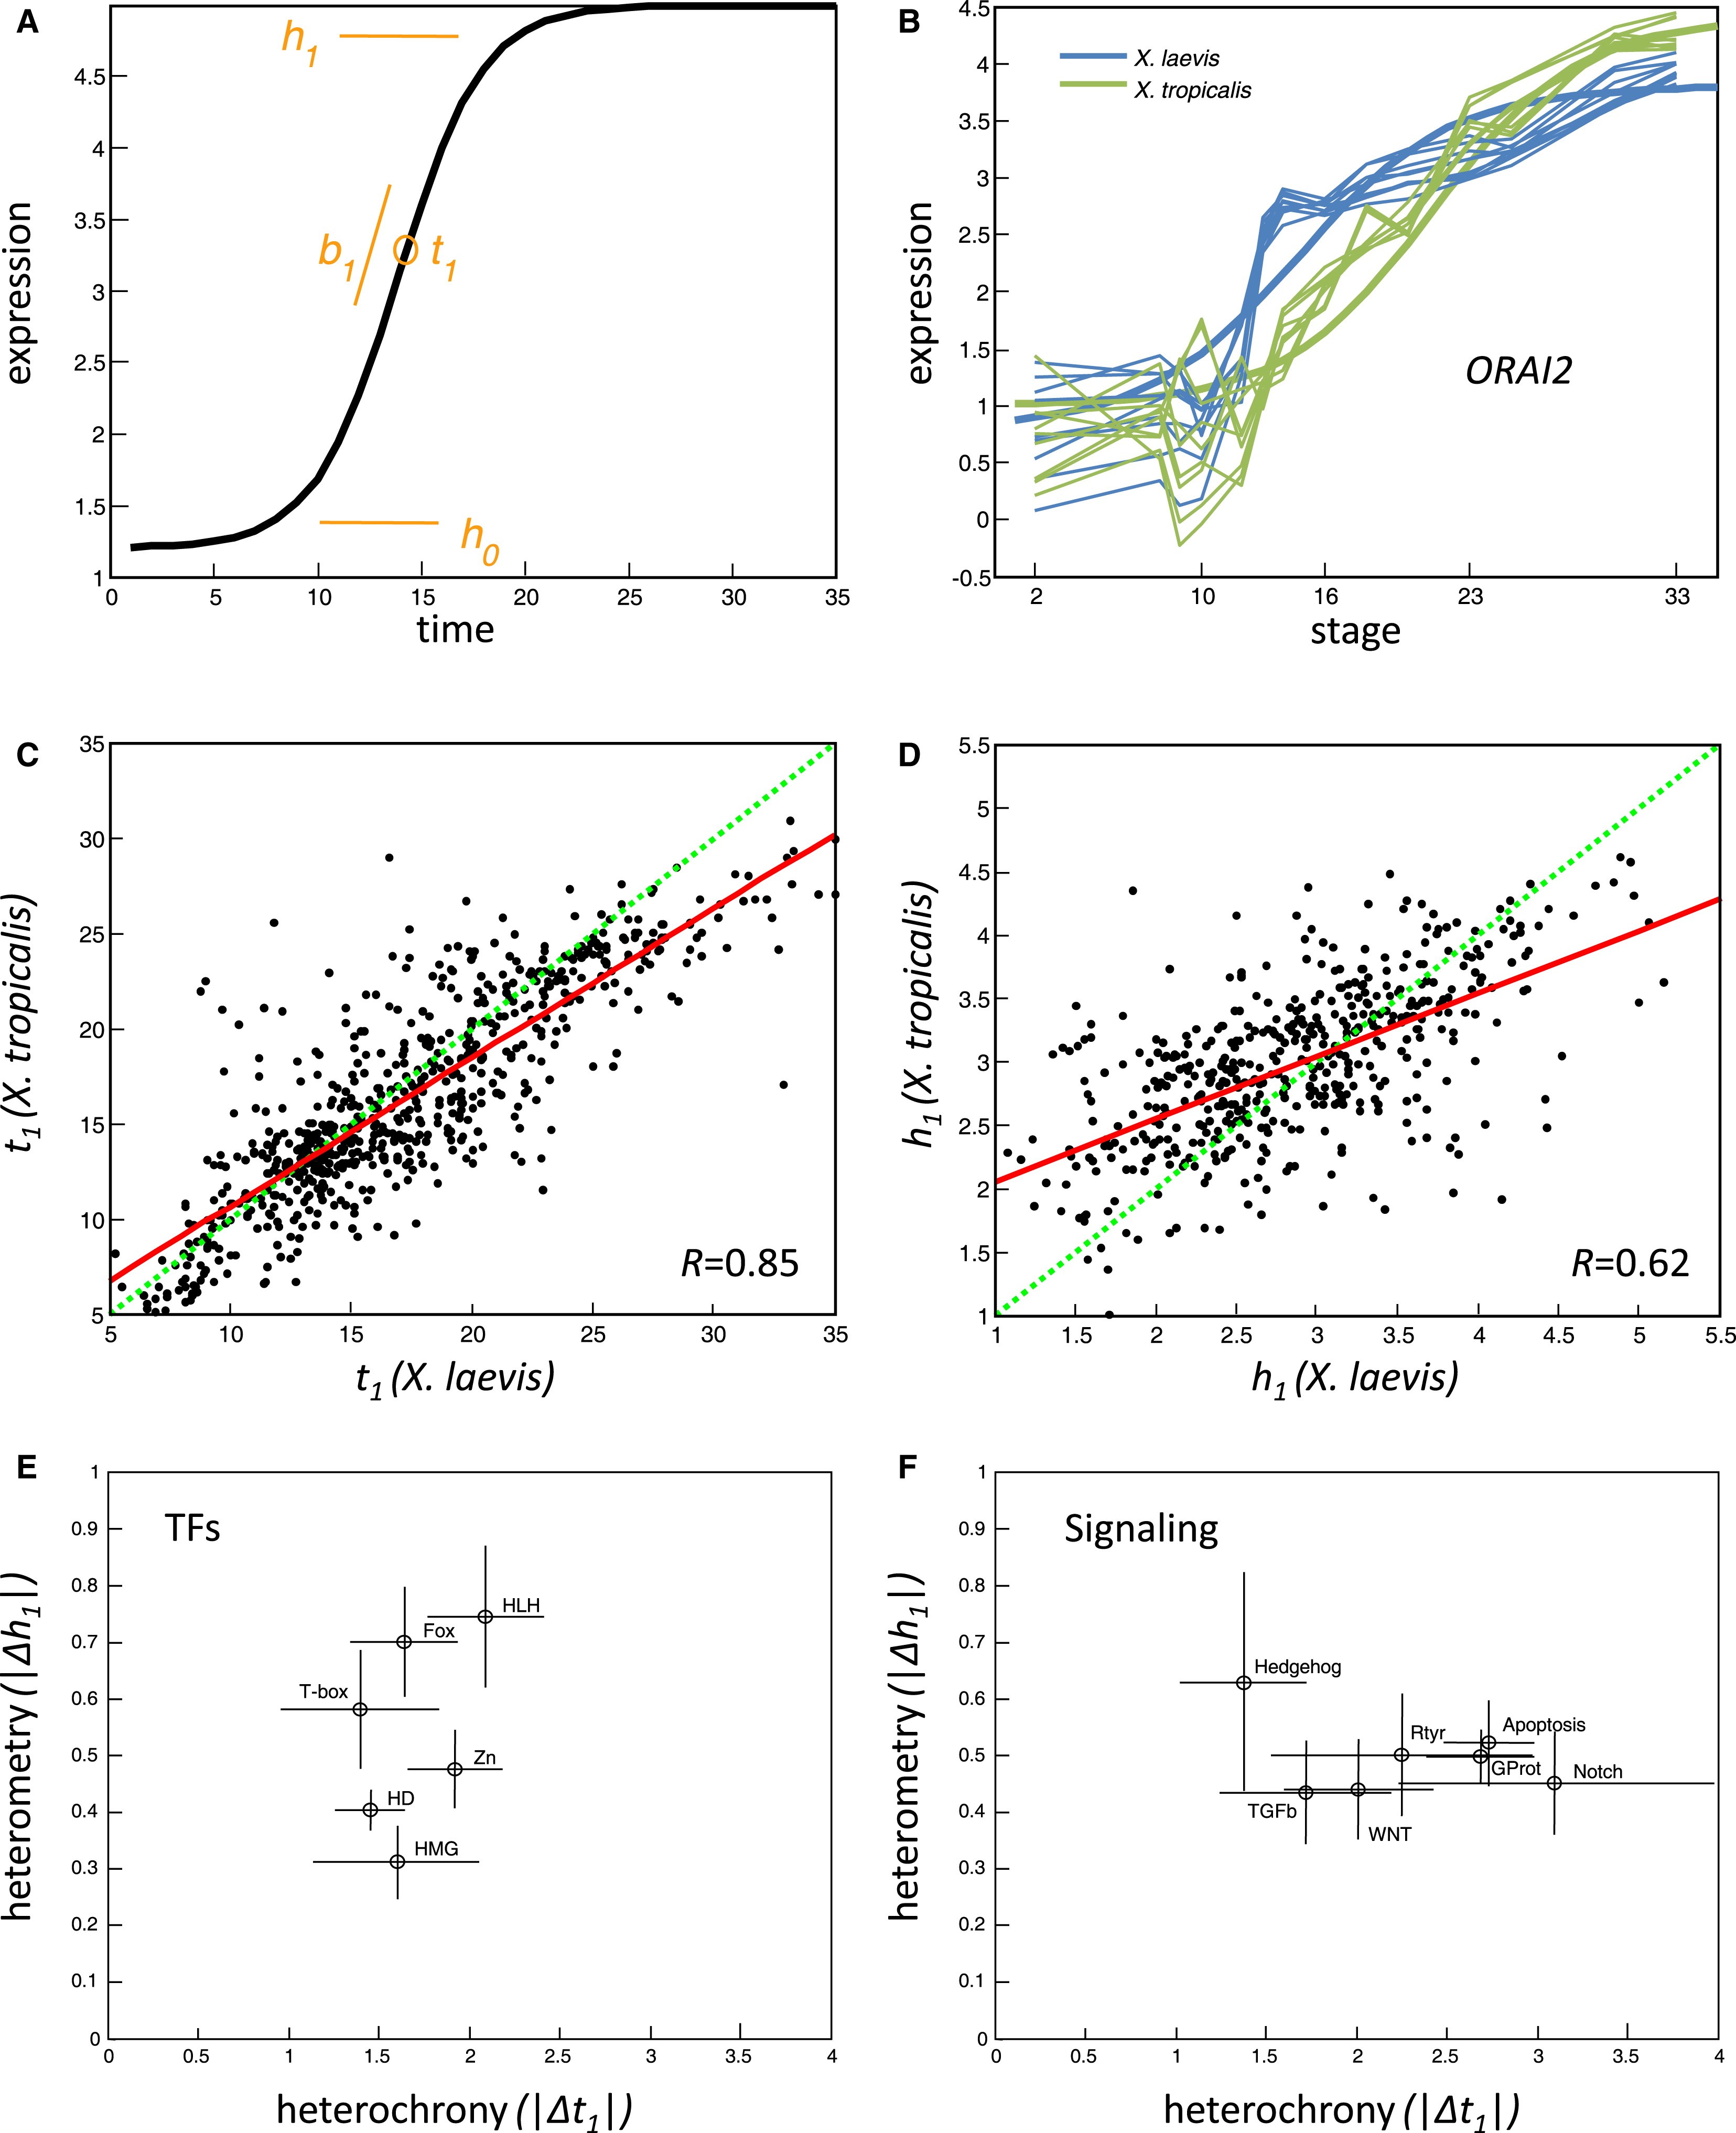
Figure 4. Heterochrony and Heterometry in Gene Expression Evolution(A) A sigmoid is defined by b1, t1, h0, and h1 (see text).(B) The ORAI2 gene expression profiles (log10 relative concentrations) in both X. laevis and X. tropicalis is shown fitted by sigmoids.(C) Plots of t1 (time of induction) for pairs of genes with >0.8 goodness of fit in both species. The green line is unity and the red is fitted to the data.(D) Plots of h1 (range of expression). Same format as (C).(E and F) Heterochrony/heterometry phase-plane for families of transcription factors (E) and several signaling pathways (F). The circles and lines indicate the mean and standard deviation of each gene set's heterochronies and heterometries. The transcription factor families are helix-loop-helix (PF00010, 27 genes with sigmoids), Homeobox (IPR001356, 74 genes), Zinc finger (C2H2 type, IPR007087, 24 genes), T-box (IPR001699, 5 genes), Fox head (IPR001766, 16 genes), and HMG (IPR000910, 8 genes). The signaling pathways are Wnt receptor (GO:0016055, 18 genes with sigmoids), transforming growth factor beta receptor (GO:0007179, 13 genes), Hedgehog (GO:0007224, 6 genes), Transmembrane receptor protein tyrosine kinase (GO:0007169, 17 genes), Notch (GO:0007219, 9 genes), Apoptosis (GO:0006917, 40 genes), and G protein-coupled receptor protein (GO:0007186, 73 genes). Image published in: Yanai I et al. (2011) Copyright © 2011. Image reproduced with permission of the Publisher, Elsevier B. V. Larger Image Printer Friendly View |