XB-IMG-78961
Xenbase Image ID: 78961
|
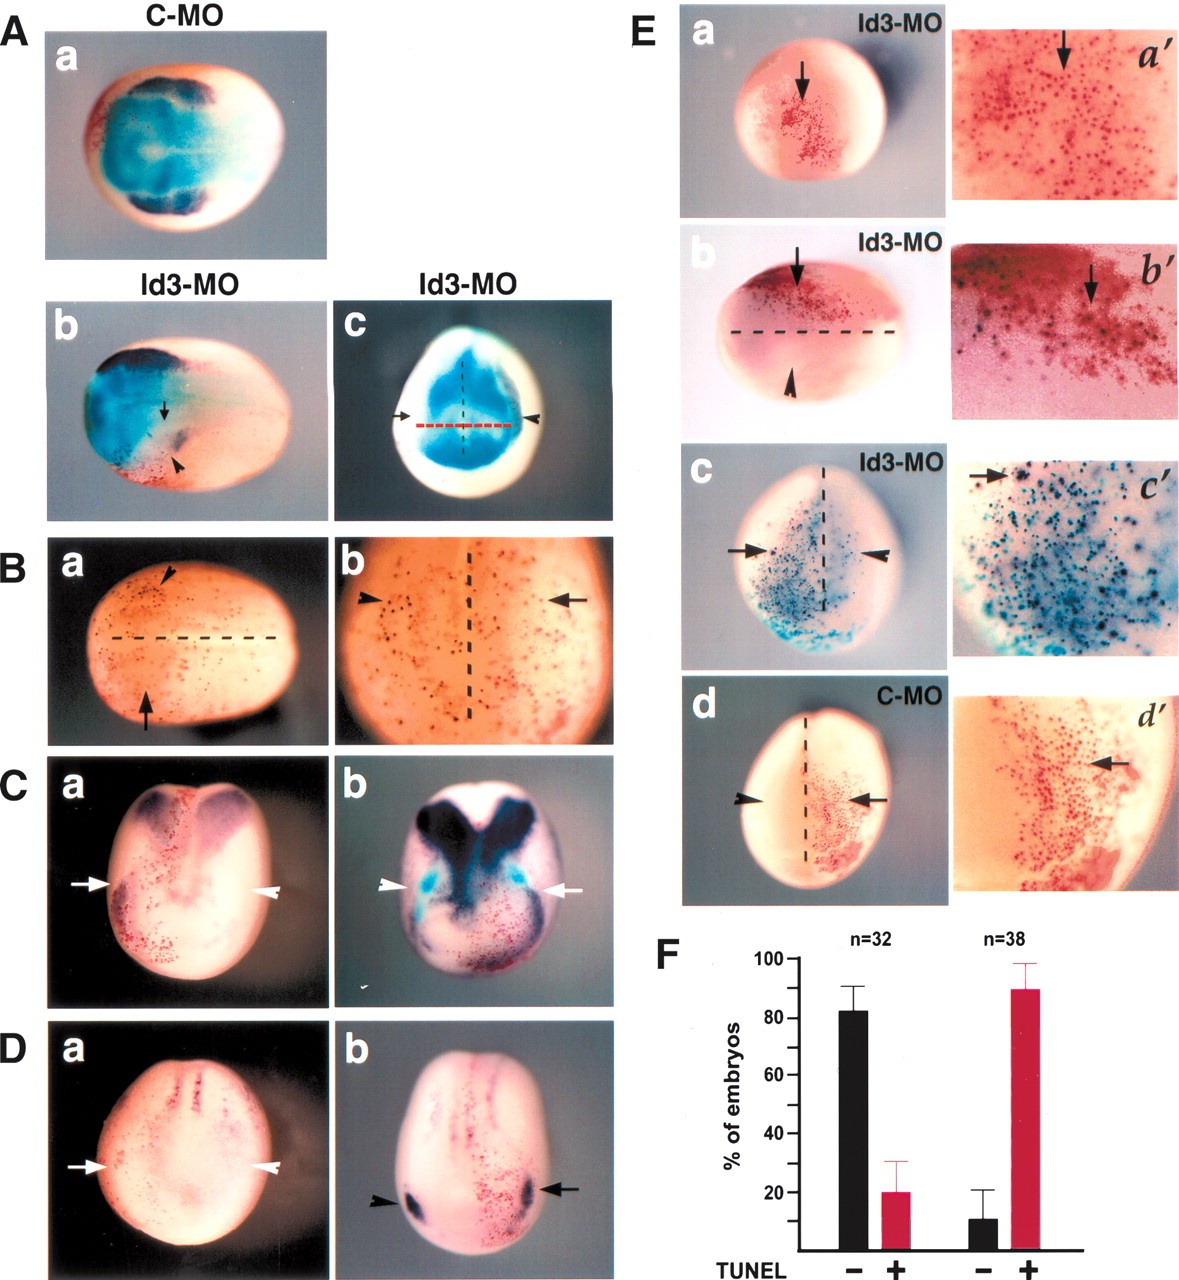
Id3 is required for cell proliferation and survival of neural crest. (A) Neurula-stage embryos injected with morpholino oligos and subjected to double in situ hybridization with FoxD3 and Sox2 RNA probes. (Panel a) Dorsal view of a control embryo (anterior toward left) shows foxD3 expression (purple) intact on the side injected with control-MO (Red-Gal). (Panels b,c) Dorsal view of an embryo (anterior toward left) injected with Id3-MO and anterior view of another embryo injected with Id3-MO show that the neural crest marker foxD3 (purple, arrowhead) is lost on the injected side (Red-Gal), while the neural plate (border line, arrow) marked by sox2 expression (light blue) is not expanded (red dotted line) and does not replace the neural crest. The black dotted line indicates the midline. (B) Cell proliferation assay measured by immunostaining with antiphosphorylated histone H3 antibody in an embryo injected with Id3-MO. Dorsal view (panel a) and magnified anterior view (panel b) of an embryo show that mitotic cells (black dots at control side, arrowhead) are absent or decreased in the neural crest region injected with Id3-MO (arrow, Red-Gal). (C) Expression of cell cycle inhibitor in the embryos injected with Id3-MO. (Panel a) p27XicI (purple, arrow) is ectopically expressed in neural crest progenitors when Id3 is depleted (white arrow). (Panel b) Double in situ hybridization reveals that foxD3 expression (light blue, arrowhead) in neural crest is replaced by p27XicI expression (purple, arrow) at the side injected with Id3-MO (Red-Gal). (D) Differentiation markers in the embryos injected with Id3-MO. n-tubulin (panel a) and NeuroD (panel b) are not ectopically expressed in the neural crest at the side injected with Id3-MO at stage 13. (Panel b) Their expression is slightly increased in trigeminal ganglia at the side injected with Id3-MO (arrow) at stage 14. (E) TUNEL staining in the embryos injected with Id3-MO or control-MO. (Panels a,a′) Id3-MO-injected region (Red-Gal) of a stage 11 embryo is negative (arrow, no black dot) in TUNEL staining. (Panels b,b′) Dorsal view of a stage 14 embryo (anterior toward left) shows significantly increased cell death (black dots, arrow) on the neural crest region injected with Id3-MO (Red-Gal), compared with the uninjected side (arrowhead). (Panels c,c′) Anterior view of a stage 17 embryo also shows elevated cell death (black dots, arrow) on the neural crest region injected with Id3-MO (X-gal staining, turquoise color), compared with the uninjected side (arrowhead). (Panels d,d′) Anterior view of a stage 16 embryo injected with control-MO shows that cell death doesn't occur in the injected region (Red-Gal, arrow), compared with the uninjected side (arrowhead). The MO-injected region is magnified for each embryo in a′-d′. (F) The graph illustrating the results of TUNEL staining as percentages of TUNEL-negative (black bar) or TUNEL-positive (red bar) embryos out of the embryos injected with control-MO or Id3-MO. Image published in: Kee Y and Bronner-Fraser M (2005) Copyright © 2005. Image reproduced on with permission of the Publisher, Cold Spring Harbor Laboratory Press. This is an Open Access article. Larger Image Printer Friendly View |