XB-IMG-78992
Xenbase Image ID: 78992
|
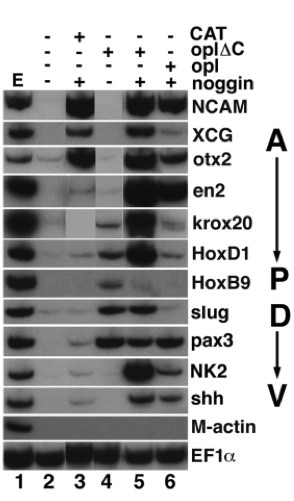
Fig. 10. opl synergizes with noggin to activate more posterior neural markers in animal caps. Wild-type embryos were injected in both blastomeres with indicated RNAs at the 2-cell stage, using 200 pg CAT, opl or oplDC, and 10 pg noggin (Smith and Harland, 1992) RNAs, as diagrammed in Fig. 8A. Injection of CAT RNA served as negative control by equalizing the injected RNA dose. Pools of 15-20 animal caps were isolated from injected embryos at late blastula (stage 9) and incubated in saline until harvest at tailbud (stage 22) for RT-PCR analysis. See Methods for details. Expression of a set of neural markers expressed along the anteroposterior (A/P) or dorsoventral (D/V) neural axes was analysed. Uninjected embryos serve as control for baseline expression level. NCAM is a general neural marker (Kintner and Melton, 1987). Expressed in the indicated anterior (A)-to-posterior (P) series: XCG is a cement gland marker, the most anterior ectodermal tissue (Sive et al., 1989); otx-2 is a forebrain and cement gland marker (Blitz and Cho, 1995; Pannese et al., 1995); en2 is a marker of mid/hindbrain boundary (Hemmati-Brivanlou and Harland, 1989); krox20 marks rhombomeres 3 and 5 in the presumptive hindbrain (Bradley et al., 1993); HoxD1 is a hindbrain (posterior to rhombomere 4) and spinal cord marker (Kolm and Sive, 1995a), and HoxB9 is a spinal cord marker (Wright et al., 1990). Expressed in the indicated dorsal (D) to ventral (V) series of markers, slug (marking the neural crest, (Mayor et al., 1995)), pax3 (marking the dorsal neural tube, (Espeseth et al., 1995)), NK2 (marking the ventrolateral neural tube, (Saha et al., 1993)) and shh (marking the floorplate, (Ekker et al., 1995)). M-actin (Mohun et al., 1984) is a mesodermal marker; EF1a (Krieg et al., 1989) served as loading control. Samples processed without RT did not show EF1a signal after PCR (not shown). Data from one experiment are shown, comparable results were obtained in four independent experiments. Lane 1, stage 22 embryo; lane 2, uninjected animal caps; lane 3, noggin plus CAT-injected; lane 4, oplDC-injected; lane 5, noggin plus oplDC-injected; lane 6, noggin plus opl-injected. Image published in: Kuo JS et al. (1998) Copyright © 1998. Image reproduced with permission of the publisher and the copyright holder. This is an Open Access article distributed under the terms of the Creative Commons Attribution License. Larger Image Printer Friendly View |