XB-IMG-79494
Xenbase Image ID: 79494

|
|
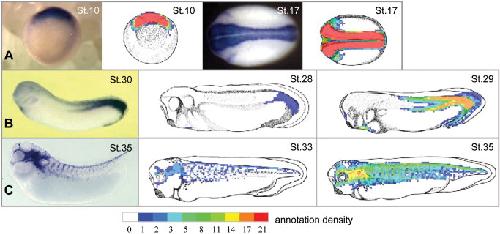
Figure 2. Results from the comparison annotation test set. All 21 annotators were presented with a test set of 16 images to annotate over the course of the jamboree, to get an informal assessment of annotation confidence levels. The images spanned a wide range of development stages. A: The in situ images and the annotation heat maps for two of the consistently annotated test images, where red shows agreement over all annotators. B,C: The in situ images and the heat maps for two less consistently annotated images, where annotators have not agreed about staging. The test in situ images are shown side by side with the corresponding schematic diagrams. A: The gastrula stage 10 embryo is shown, viewed from the vegetal pole with the blastopore side up; the neurula stage 17 embryo is shown as a dorsal view, anterior to the left. B,C: Tail bud stage embryos are shown as lateral views, dorsal to the top and anterior to the right. Annotation is based on cells with dimensions 1/40th the height of the schematic, and in these heat maps the annotation density of each cell is the sum of the individual image annotations performed on each schematic. Schematic diagrams: copyright 1994 from âNormal Table of Xenopus laevisâ by Nieuwkoop and Faber. Reproduced by permission of Garland Science/Taylor & Francis, LLC.Download figure to PowerPoint Image published in: Gilchrist MJ et al. (2009) Copyright © 2009. Image reproduced with permission of the Publisher, John Wiley & Sons. Larger Image Printer Friendly View |
