XB-IMG-80378
Xenbase Image ID: 80378
|
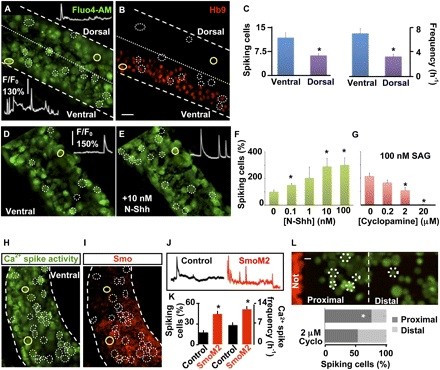
Fig. 2.
Shh increases Ca2+ spike activity of developing spinal neurons. (A) Lateral view of a developing spinal cord showing higher levels of Ca2+ spike activity in the ventral than in the dorsal neural tube (stage 24). (B) After imaging, the same preparation was whole-mount immunostained for homeodomain protein Hb9, a ventrally expressed neuronal marker, to indicate its dorsoventral orientation. Circles identify cells spiking during 20-min recording, and Insets in A show Ca2+ spike activity for cells outlined in yellow. (C) Incidence of spiking cells per neural tube and frequency of Ca2+ spikes in ventral and dorsal spinal neurons. (D and E) Ventral view of stage-24 developing spinal cord in the absence (D) or presence (E) of N-Shh. Insets show Ca2+ spike activity during 15-min recording from the same cell (outlined in yellow). (F) Doseesponse curve for N-Shhnduced Ca2+ spike activity. Data are mean SEM percent of spiking cells in the presence of N-Shh compared to number of cells spiking before addition of N-Shh (0). (G) Doseesponse curve for cyclopamine blockade of Ca2+ spike activity induced by SAG. Data are mean SEM percent of spiking cells in the presence of SAG and cyclopamine compared to number of cells spiking before addition of cyclopamine (0). (H) Expression of SmoM2 increases Ca2+ spike activity. (H) Electroporation of a stage-19 embryo with SmoM2 demonstrates a higher incidence of Ca2+ spike activity 6 h after electroporation (stage 24) in electroporated cells (red) than in nonelectroporated cells (black). (I) Effective overexpression of SmoM2 was verified by whole-mount immunostaining against Smo after Ca2+ imaging. Circles identify cells spiking during recording. (J) Ca2+ spike activity during 20-min recording for immunonegative and immunopositive cells outlined in yellow in H and I. (K) Bar graphs show mean SEM percent incidence of spiking cells and spike frequency for electroporated (SmoM2) and nonelectroporated (Control) cells. n = 5 stage-24 (26-h postfertilization) embryos per experimental group (C). (L) Endogenous Shh released by the notochord increases Ca2+ spike activity of neurons. (Upper) Dissociated neuron/notochord explant (Not) coculture. (Lower) The imaged field was divided in halves proximal and distal to the notochord explant. Values are mean SEM percent of spiking cells in proximal and distal regions in the absence or presence of cyclopamine (Cyclo). n = 5 independent cultures; *P < 0.05. (Scale bars, 20 μm.) Image published in: Belgacem YH and Borodinsky LN (2011) Copyright © 2011. Image reproduced with permission of the publisher and the copyright holder. This is an Open Access article distributed under the terms of the Creative Commons Attribution License. Larger Image Printer Friendly View |