XB-IMG-81557
Xenbase Image ID: 81557
|
|
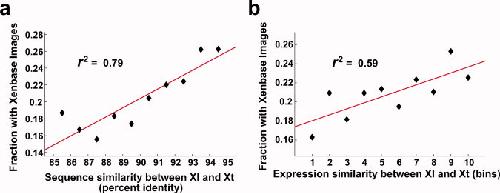
Figure 3. Biases of Xenopus research towards genes with higher conservation of sequence and expression. a. Genes with Xenbase expression images as a function of their sequence similarity. The plot indicates the fraction of genes with expression images in Xenbase for the shown sequence similarity ranges. b. Genes with Xenbase expression images as a function of their expression similarity. Expression divergences between X. laevis and X. tropicalis (Yanai et al.,2011) were sorted and split into equally populated bins. The fraction of genes in each bin with Xenbase images is shown.
Reproduced with permission of the Publisher, John Wiley & Sons. Image published in: Beer R et al. (2012) Copyright © 2012. Image reproduced with permission of the Publisher, John Wiley & Sons. Larger Image Printer Friendly View |