XB-IMG-81915
Xenbase Image ID: 81915
|
Figure 8.
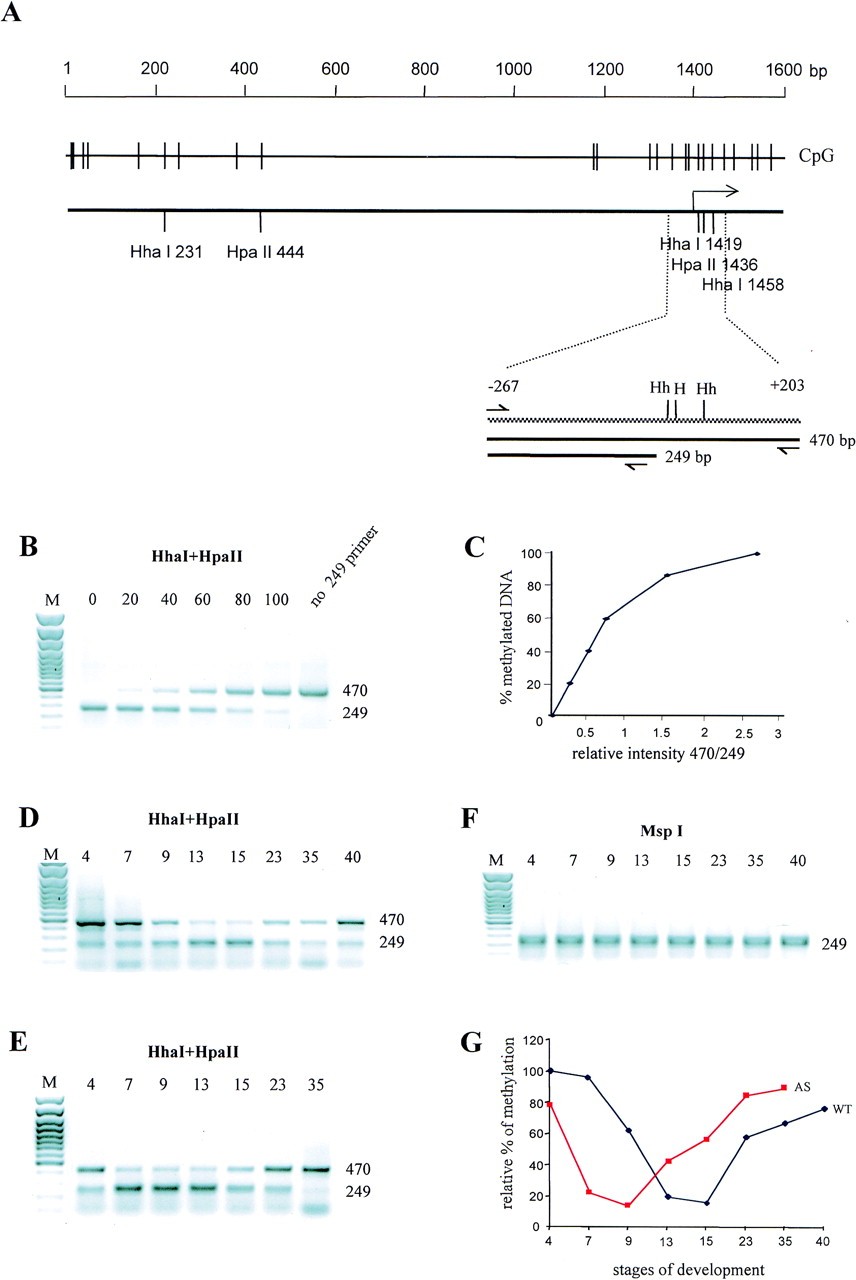
Sequences of Xbra promoter are hypomethylated earlier in xDnmt1-depleted embryos. (A) Schematic presentation of 1.6-kb region that covers the promoter and the first exon of Xbra gene. The CpG pairs in the sequence are shown by vertical lines. Underneath the CpG plot are indicated HpaII and HhaI sites. The position of transcriptional initiation is marked by an arrow. Sequences that were analyzed by methylation-sensitive PCR during development are shown on the expanded region below. A 470-bp PCR product covers the sequences between â267 and +203 where there are two HhaI (Hh) sites and one HpaII (H) site. The 470-bp band is produced only if the methylation-sensitive enzymes HpaII and HhaI do not cleave in these sites. When the restriction sites are cleaved it results in the appearance of 249-bp PCR product and is indicative of hypomethylation (see Materials and Methods). Digestion withMspI (which is not methylation sensitive) gives rise to the shorter product only. (B) To create a quantitative standard curve, a plasmid containing the Xbra promoter and part of the first Xbra exon (Latinkic et al. 1997) was methylated in vitro by SssI methylase and mixed with nonmethylated Xbraplasmid in the combinations shown. The mixtures were digested withHpaII and HhaI and used for PCR amplification resulting in fragments of 470 and 249, respectively. The percentage of methylation is indicated on top of each lane. M is a 100-bp DNA marker. (C) Standard curve generated from plotting the ratio of 470/249 fragments (X axis) against the percentage of DNA methylation (Y axis). (D) Genomic DNA samples from staged embryos indicated by numbers from 40 (stage) were digested withHhaI and HpaII and analyzed by methylation-sensitive PCR. (E) Genomic DNA samples of the xDnmt1-depleted embryos at equivalent stages to the wild type in B, indicated by numbers from 4 to 35, were digested with HhaI and HpaII, and subjected to PCR analysis as in B. (F) The same of set of DNA samples as in D was digested with MspI and analyzed as above. (G) Graphical plot of methylation changes in Xbra promoter during development of the normal (WT) and xDnmt1-depleted (AS) embryos. The ratio of 470-bp to 249-bp PCR products for each sample was quantitatively estimated and plotted against a standard curve to give the amount of methylated Xbra promoter as a % of the totalXbra promoter sequences present in the PCR reaction of genomic DNA at the indicated stages. Image published in: Stancheva I and Meehan RR (2000) Copyright © 2000. Image reproduced with permission of the Publisher. Larger Image Printer Friendly View |