XB-IMG-82918
Xenbase Image ID: 82918
|
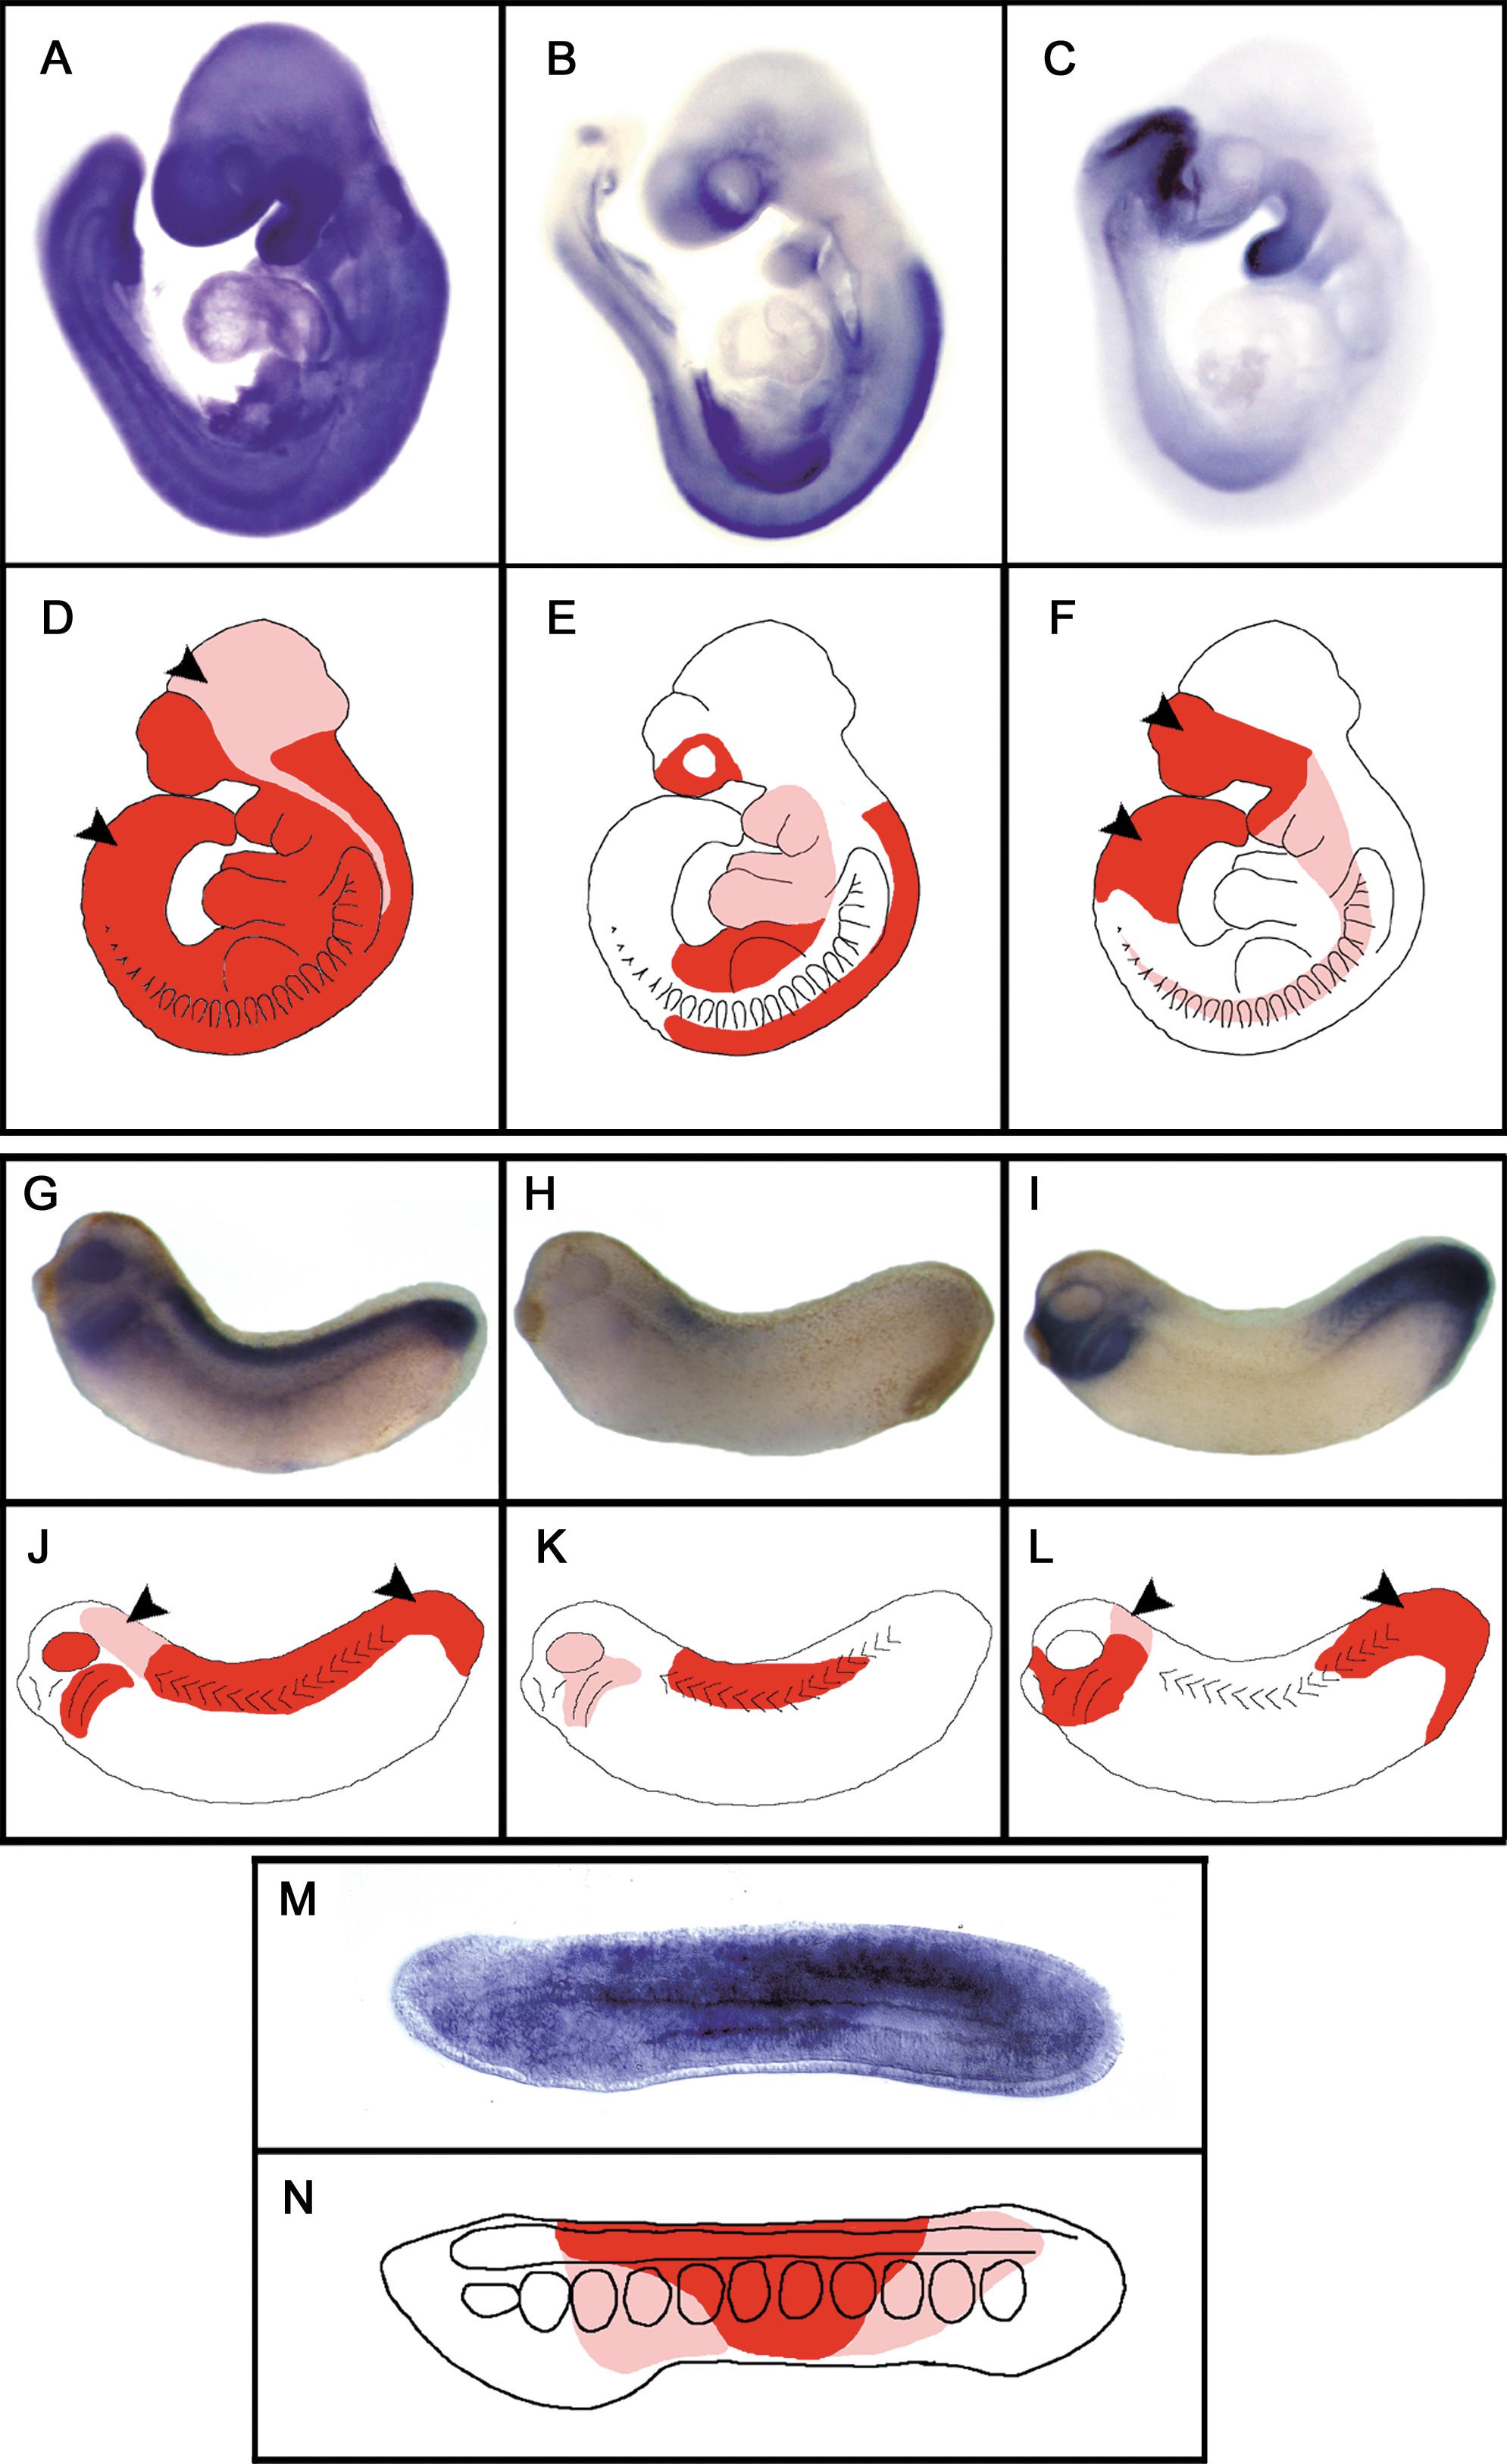
Figure 5. Schematic Representation of the Expression Territories of RARs
Staining of embryos indicates expression of mRARα (A), mRARβ (B), and mRARγ (C) in mouse embryos at E9; of xRARα (G), xRARβ (H), and xRARγ (I) in stage 30 Xenopus embryos, and of AmphiRAR (M) in 20 h old amphioxus larvae. Schematic representations are shown of the expression territories of mRARs (D�F), xRARs (J�L), and AmphiRAR (N) in mouse, Xenopus, and amphioxus embryos, respectively. Regions with high levels of expression are red and those with lower levels of expression are pink. Arrowheads indicate regions in mouse and Xenopus embryos where the RAR expression cannot be correlated with AmphiRAR expression and can be described as �new expression territories.�
doi:10.1371/journal.pgen.0020102.g005 Image published in: Escriva H et al. (2006) Copyright: © 2006 Escriva et al. Creative Commons Attribution license
Image source: Published Larger Image Printer Friendly View |