XB-IMG-83458
Xenbase Image ID: 83458

|
|
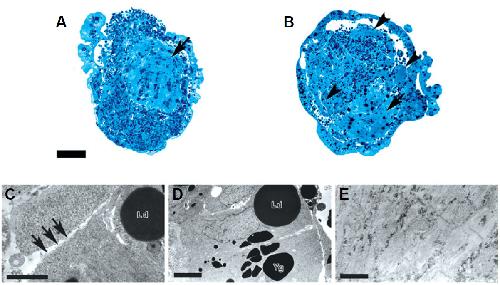
Fig. 4. Induction experiments in
XTRAP-γ MO-injected animal caps.
Two-cell stage embryos were injected
with 40 ng/embryo XTRAP-γ MO. All
animal caps were treated with activin/
retinoic acid for 3 h. (A,B) For light
microscopy, semi-thin sections were
stained with 0.1% toluidine blue solution.
(A) Pronephros differentiation
was markedly inhibited by XTRAP-γ
MO (arrow indicates muscle tissues)
compared with (B) animal caps of the
control (arrowhead indicates pronephros
tissues). (C,D,E) For electron microscopy,
ultra-thin sections were
double stained with uranyl acetate
and lead citrate. Only samples injected
with XTRAP-γ MO are shown (C,D).
The results show the condensation of
mesodermal cells and a radial arrange-
Fig. 5. Whole-mount in situ hybridization
shows the effect on
expression of pronephros marker
genes XTRAP-γ MO injection.
Embryos were injected with XTRAP-
γ MO (40 ng) or 5-mis-XTRAP-γ MO
(40 ng) and synthetic of β-galactosidase
mRNA (250 ng), then fixed at
stage 30/31 (A-P) and stage 22/23
(Q-T). Expression of Lim-1 was
increased in the side of embryos
injected with XTRAP-γ MO (A),
compared the non-injected side (B).
Expression of Pax-2 and Wnt-4
was inhibited by injection of XTRAP-
γ MO (E,I), compared with noninjected
side (F,J). For those embryos
fixed at stage 22/23, expression
of Pax-2 (Q) and Wnt-4 (S) in
embryos fixed at stage 22/23 was
not affected by injection of XTRAP-
γ MO or the control 5-mis-XTRAP-
γ MO (R,T). Expression of Pax-8
was not affected by XTRAP-γ MO
(M,N). The expression of Lim-1
(C,D), Pax-2 (G,H), Wnt-4 (K,L)
and Pax-8 (O,P) was unchanged in
embryos injected with 5-mis-
XTRAP-γ MO.The cells with the basal membrane (arrows), however the unique pronephric cells with microvillus was invisible. (E) Muscle differentiation was
normal. Ld, lipid droplet; Yg, yolk granule. Scale bar of (A,B) is 100 μm; scale bar of (C,D) is 1 μm; scale bar of (E) is 5 μm. Image published in: Li DH et al. (2005) Copyright © 2005. Image reproduced with permission of the Publisher. Larger Image Printer Friendly View |
