XB-IMG-84489
Xenbase Image ID: 84489
|
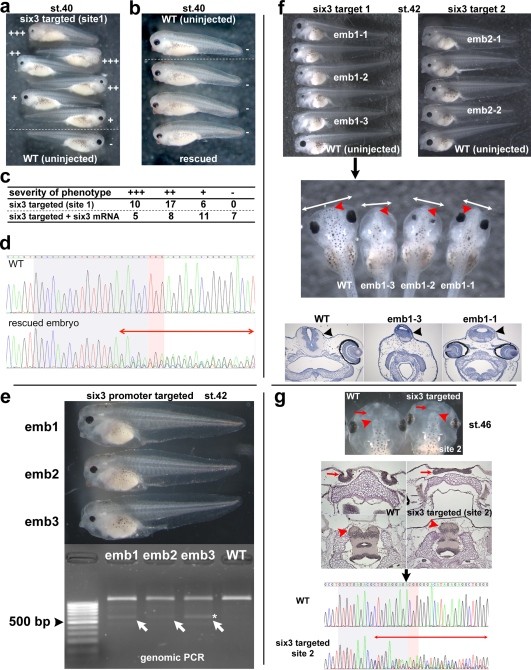
Figure 4. Summary of phenotype caused by mutations of six3 gene. All targeted mutations showed a similar phenotype. (a-d) Phenotype variations seen in st.40 embryos targeted with the sgRNA for coding region site 1. By this stage, the obvious phenotype is significantly reduced eye size, but a brain defect (see below) is not yet obvious. The phenotype is six3-specific because it was partially rescued by coinjection of six3 mRNA (b, c). Severity of phenotype was scored as +++ (most severe, no eye or tiny piece of eye), ++ (severe, small and malformed eye),â+â(modest, small relatively normal looking eye), and - (no or little phenotype) (a�c). As observed with the tyr target injections, toxicity of injected RNAs varied greatly depending on batch of embryos. For example, in different experiments, the percentage of normal embryos recovered after the same RNA doses were injected (six3 target 1) varied from 43% to 87% (see Supporting Information Table S1). (d) Chromatograms of the DSP assay from an uninjected embryo (WT) and one of rescued embryos shown in (b). Perturbation of peaks is seen around the PAM region (two-headed red arrow), suggesting the presence of mutated sequences. At later stages, the brain phenotype becomes obvious (e-g). (e) Examples of the phenotype of embryos (emb1 to emb3) targeted to delete the proximal promoter region at st.42. Using the primer as schematically shown in Fig. 1b (green arrows), genomic PCR of sibling uninjected wild-type embryo showed an expected â¼ 1.2 kbp band, whereas embryos injected with sgRNAs had an extra â¼ 0.6 kbp band (emb1-3, white arrows). One band (marked by *) was recloned and sequenced; the results are shown in Supporting Information Fig. S1. The promoter deletion injections were on average more toxic, perhaps due to higher total amounts of RNAs being injected, but survival rates as high as 68% were observed in individual experiments. (f) Phenotype examples of st. 42 embryos injected with sgRNA targeting coding region site 1 (left panel) and site 2 (right panel), lateral views. Compared to wild-type embryos (bottom, WT, round shaped head), mutant embryo heads had a more angular and flattened shape. The dorsal view (second panel) and frontal sections (third panel) of the same embryos (emb1-1, 1�2, 1�3) in first left panel clearly show narrow heads (compare two-headed white arrows between WT and mutants) and smaller brains (black arrowheads in frontal sections), especially the forebrain (red arrowheads in second panel, see also Fig. 4g) in the mutant embryos. The sequencing summary of mutated loci of emb1-1 and 1-3 in the top left panel and emb2-1, 2-2 in the top right panel are shown in Supporting Information Fig. S1. (g) A mild phenotype seen in embryos (target site 2) at st. 46. Top panel shows a dorsal view of embryos. Second panel shows horizontal sections of equivalent embryos shown in the top panel. At early stages, these embryos could be scored as wild type. Later observation of mutant embryos reveals that the nasal pits (red arrows) are fused (shown here) or shifted medially (not shown), and the telencephalon (red arrowheads) is smaller and fused. The last panel shows chromatograms of the DSP assay from one of the sectioned embryos shown above to confirm genomic mutations as evidenced by perturbation of peaks around PAM region (two-headed red arrow) in the mutant embryo. Image published in: Nakayama T et al. (2013) Copyright © 2013. Image reproduced with permission of the Publisher, John Wiley & Sons. Larger Image Printer Friendly View |