XB-IMG-84648
Xenbase Image ID: 84648
|
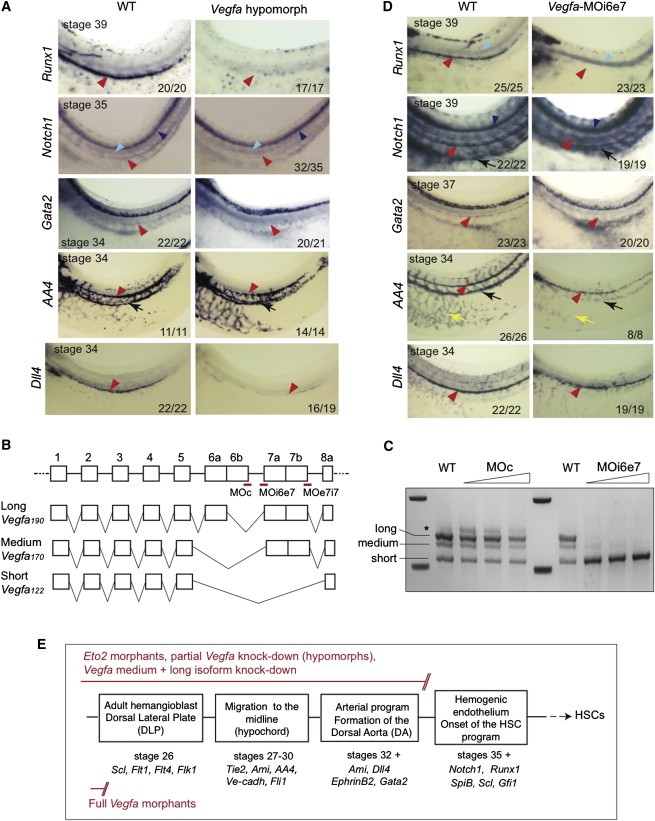
Figure 6. Hypomorphic and Isoform-Specific Knockdowns of Vegfa Phenocopy the Eto2 Morphant Phenotype(A) Hypomorphic VEGFA phenotype. The HSC program was abrogated at stage 39 (loss of Runx1 expression), and the early HSC markers Notch1 and Gata2 were absent at stages 34/35 in VEGFA hypomorphs. DA formation (as revealed by the endothelial marker AA4, at stage 34) is unaffected in VEGFA hypomorphs. Decreased expression of arterial marker Dll4 is observed in the DA of Vegfa hypomorphs at stage 34.(B) Top: structure of Xenopus laevis Vegfa gene. Open boxes, exons; thin lines, introns; not to scale. Red lines show the position of the control MO (MOc) and the MOs targeting the intron6/exon7 (MOi6e7) and exon7/intron7 (MOe7i7) splice junctions. Depicted below are the splicing events giving rise to the three known Vegfa isoforms.(C) Vegfa short, medium, and long mRNA isoforms were detected by PCR from material isolated from stage 27 wild-type (WT) embryos or embryos injected with increasing concentrations of MOi6e7 or control MOc (20, 30, and 40 ng). The ethidium-bromide-stained gel shows knockdown of expression of medium and long mRNA isoforms and increased production of the short isoform in MOi6e7 morphants. Asterisk: the band may represent one of the minor Vegfa isoforms as detected in human and mouse, although this has not been confirmed by sequencing.(D) Vegfa medium and long isoform morphant phenotype (Vegfa-MOi6e7). As for Vegfa hypomorphs (A), expression of Runx1, Notch1, and Gata2 is lost. DA formation is unaffected, as revealed by AA4 expression at stage 34. In contrast to Vegfa hypomorphs, expression of the arterial marker Dll4 appears normal.Red arrowheads, DA; light blue arrowheads, notochord; dark blue arrowheads, neural tube; black arrows, posterior cardinal veins (PCV); yellow arrows, trunk vasculature. Numbers at the bottom of the panels indicate the number of embryos with the given phenotype out of the total number examined. Whole mounts are shown with anterior to the left and dorsal to the top.(E) Schematic diagram detailing the phenotypes of ETO2 morphants, VEGFA hypomorphs, and VEGFA morphants with respect to the definitive HSC program. Molecular markers analyzed in this study are indicated for each stage of development shown.See also Figure S6. Image published in: Leung A et al. (2013) © 2013 ELL & Excerpta Medica. Creative Commons Attribution license Larger Image Printer Friendly View |