XB-IMG-86734
Xenbase Image ID: 86734
|
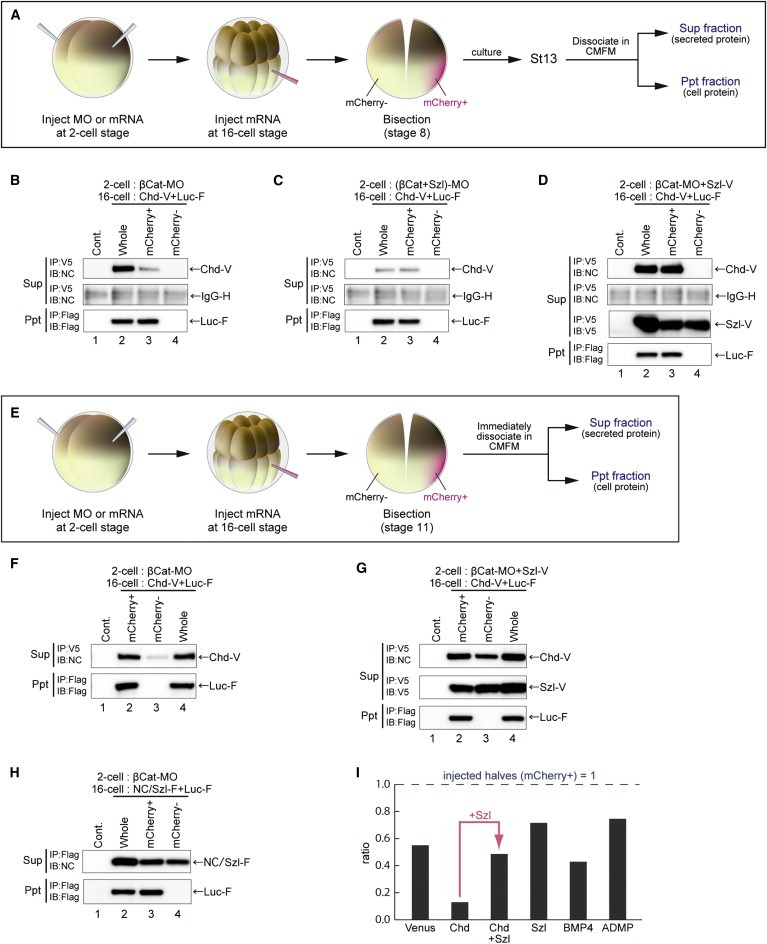
Figure 7.
Size-Dependent Control of Chordin Stability. (A) Schematic of reconstitution experiments. The dorsal axis was rescued by a single-blastomere injection of chordin (V5-tagged; 12.5 pg) in the β-catenin-depleted embryo. As a tracer, mcherry (200 pg) was coinjcted for marking the injected site. (B–D) Effect of bisection on the levels of intact Chordin protein. Lanes 1 show uninjected whole embryos. Lanes 2 show whole embryos with mRNA injection. Lanes 3 show injected halves (mCherry+). Lanes 4 show uninjected halves (mCherry−). IgG-H is the loading control for interexperimental comparison for (B)through (D). In (B), the amount of intact Chordin (top) was decreased in the dorsal halves as compared to that in the same number of the whole embryos. This contrasted the largely constant amounts of control luciferase (bottom; 150 pg luciferase mRNA injection). As shown in (C), when Sizzled was depleted in addition, the amounts of intact Chordin with (lane 3) or without (lane 2) bisection were comparable and low. In the Sizzled-overexpressed conditions in (D), the amounts of intact Chordin with (lane 3) or without (lane 2) bisection were comparable and high. (E–I) Analysis of long-range protein distribution at the early gastrula stage. (E) Schematic of comparison of protein contents in “injected” (mCherry+) and “uninjected” (mCherry−) halves of the stage 11 embryo. In (F), epitope-tagged Chordin was predominantly detected in the “injected” halves (lane 2). In (G), when Sizzled was overexpressed, epitope-tagged Chordin was detected also in the “uninjected” halves. In (H), Sizzled (12.5 pg), expressed on one side, was detected on the other side. (I) shows ratios of protein levels detected in the “uninjected” halves (the level in the “injected” halves is defined as 1). See also Figure S7. Image published in: Inomata H et al. (2013) Copyright © 2013. Image reproduced with permission of the Publisher, Elsevier B. V. Larger Image Printer Friendly View |