Genome evolution in the allotetraploid frog Xenopus laevis
Session et al. Nature 538, 336–343 (20 October 2016) doi:10.1038/nature19840
Abstract
To explore the origins and consequences of tetraploidy in the African clawed frog, we sequenced the Xenopus laevis genome and compared it to the related diploid X. tropicalis genome. We characterize the allotetraploid origin of X. laevis by partitioning its genome into two homoeologous subgenomes, marked by distinct families of ‘fossil’ transposable elements. On the basis of the activity of these elements and the age of hundreds of unitary pseudogenes, we estimate that the two diploid progenitor species diverged around 34 million years ago (Ma) and combined to form an allotetraploid around 17–18 Ma. More than 56% of all genes were retained in two homoeologous copies. Protein function, gene expression, and the amount of conserved flanking sequence all correlate with retention rates. The subgenomes have evolved asymmetrically, with one chromosome set more often preserving the ancestral state and the other experiencing more gene loss, deletion, rearrangement, and reduced gene expression.
Click here to view this article in Nature - open access article.
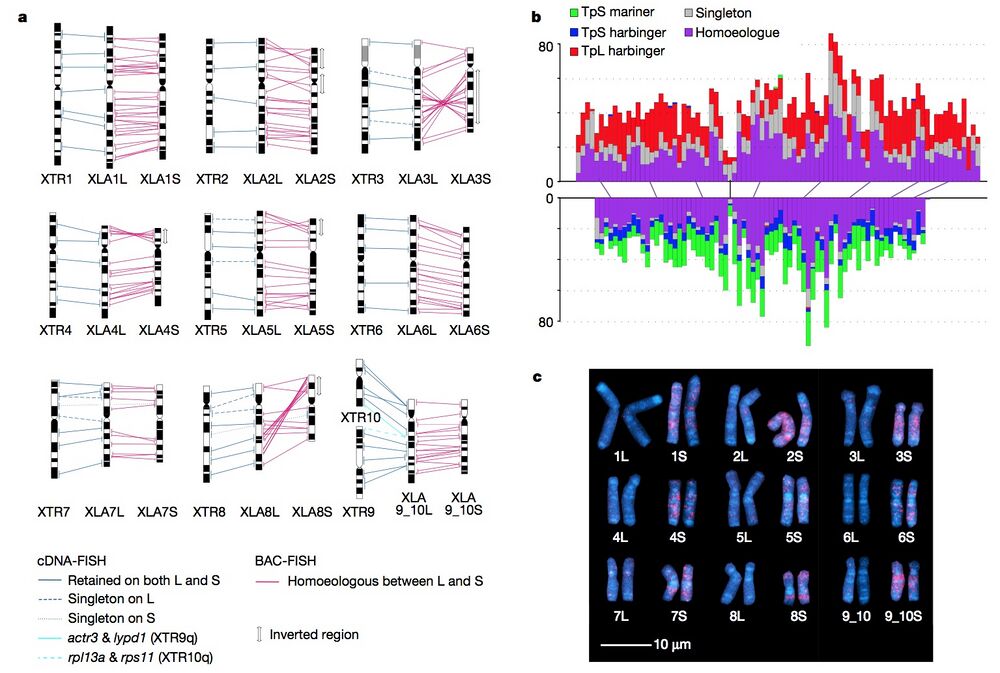
Figure 1 | Chromosome evolution in Xenopus. a, Comparative cytogenetic map of XLA (Xenopus laevis) and XTR (Xenopus tropicalis) chromosomes. Magenta lines show relationships of chromosomal locations of 198 homoeologous gene pairs between XLA.L and XLA.S chromosomes, identified by FISH mapping using BAC clones (Supplementary Table 1 and Supplementary Note 3.1). Blue lines show relationships of chromosomal locations of orthologous genes between XTR chromosomes and (i) both XLA.L and XLA.S chromosomes (solid line) (lines between XLA.L and XLA.S are omitted), (ii) only XLA.L (dashed), or (iii) only XLA.S (dotted), which were taken from our previous studies14,15. Light blue lines indicate positional relationships of actr3 and lypd1 on XTR9q and rpl13a and rps11 on XTR10q with those on XLA9_10LS chromosomes (Supplementary Note 6.2). Double-headed arrows on the right of XLA.S chromosomes indicate the chromosomal regions in which inversions occurred. Ideograms of XTR and XLA chromosomes were taken from our previous reports15,16. b, Distribution of homoeologous genes (purple), singletons (grey) and subgenome-specific repeats across XLA1L (top) and XLA1S (bottom). Xl-TpL_harb is red, Xl-TpS_harb is blue, and Xl-TpS_mar is green. Purple lines mark homoeologous genes present in both L and S chromosomes, the black line marks the approximate centromere location on each chromosome. The homoeologous gene pairs, from left to right: rnf4, spcs3, intsl2, foxa1, sds, ap3s1, lifr, aqp7. Each bin is 3 Mb in size, with 0.5 Mb overlap with the previous bin. c, Chromosomal localization of the Xl-TpS_mar sequence with fluorescence in situ hybridization. Hybridization signals were only observed on the S chromosomes. Scale bar,10μm.
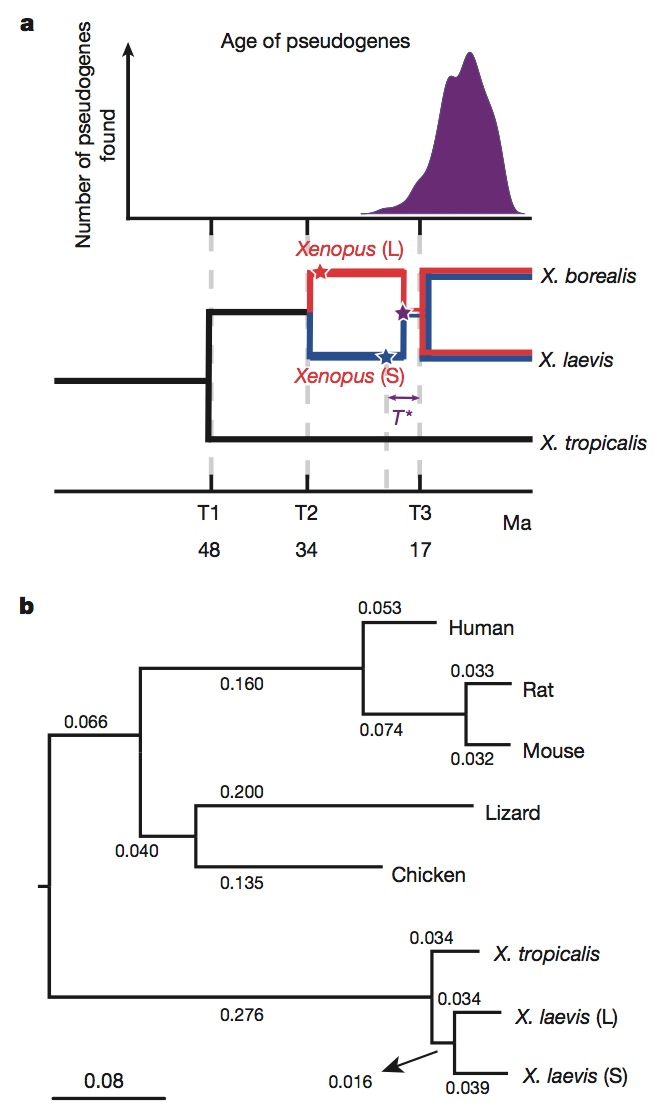
Figure 2 | Molecular evolution and allotetraploidy. a, The distribution of pseudogene ages, as described in Supplementary Note 9 (top). Phylogenetic tree illustrating the different epochs in Xenopus (bottom), with times based on protein-coding gene phylogeny of pipids, including Xenopus, Pipa carvalhoi, Hymenochirus boettgeri and Rana pipiens (only Xenopus depicted). We date the speciation of X. tropicalis and the X. laevis ancestor at 48 Ma, the L and S polyploid progenitors at 34 Ma and the divergence of the polyploid Xenopus radiation at 17 Ma. Using these times as calibration points, we estimate bursts of transposon activity at 18 Ma (mariner, blue star) and 33–34 Ma (harbinger, red star). The purple star is the time of hybridization, around 17–18 Ma. b, Phylogenetic tree based on protein-coding genes of tetrapods, rooted by elephant shark (not shown). Alignments were done by MACSE (multiple alignment of coding sequences accounting for frameshifts and stop codons) and the maximum-likelihood tree was built by PhyML. Branch length scale shown at the bottom for 0.08 substitutions per site.The difference in branch length between Xenopus laevis-L and Xenopus laevis-S is similar to that seen between mouse and rat. Both subgenomes of X. laevis have longer branch lengths than X. tropicalis.
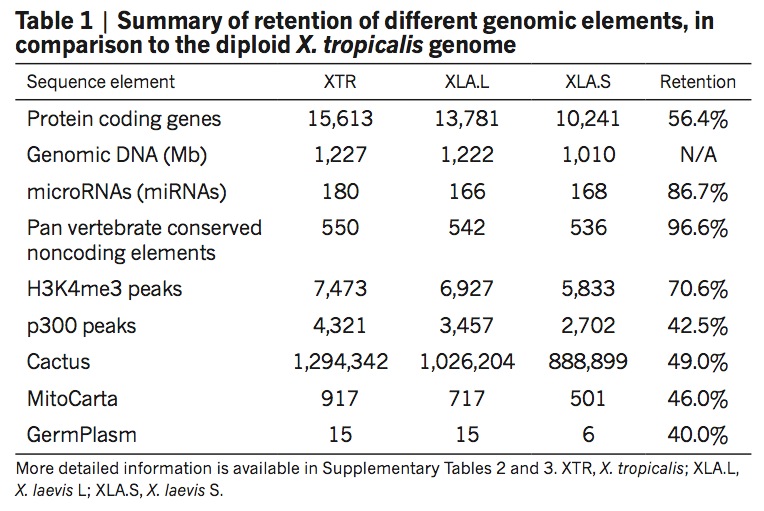
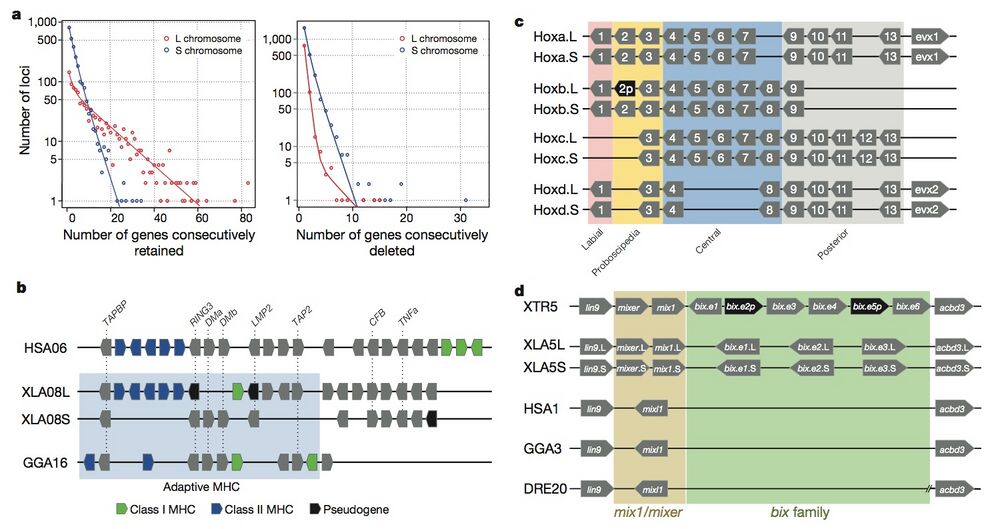
Figure 3 | Structural response to allotetraploidy. a, Distributions of consecutive retentions (left) and deletions (right) in the L (red) and S (blue) subgenomes. The distributions were fit using the equationy = a × (ebx) + c × (edx). The y axis is shown on a log scale. Significant differences were seen between L and S subgenomes in both distributions (Student’s t-test, retention, P = 3.6 × 10⁻²²; deletion, P = 4.5 × 10−84). b, Evolutionary conservation of the Xenopus major histocompatibility complex (MHC) and differential MHC silencing on the two X. laevis subgenomes. Selected gene names shown above. The ‘Adaptive MHC’ encodes tightly-linked essential genes involved in antigen presentation to T cells; this group of genes is the primordial linkage group and has been preserved in most non-mammalian vertebrates, including Xenopus. Differential gene silencing is particularly pronounced, as four genes around the class I gene are functional on the S chromosome, but absent (dma and dmb (MHC-class II domain alpha and beta) or pseudogenes (ring3, really interesting new gene 3; lmp2, large multifunctional proteasome 2) on the L chromosome. The gene map is not to scale; pseudogenes are noted as indicated. HSA, Homo sapiens MHC; XLA Xenopus laevis MHC; GGA Gallus gallus (chicken) MHC. Refer to the Supplementary Table 8 for a more detailed MHC map. TAPBP, TAP binding protein, or tapasin; TAP2, antigen peptide transporter 2; CFB, complement factor B and TNFa, tumor necrosis factor α. c, Hox gene clusters. X. laevis retains eight hox clusters, consisting of pairs of hoxa, b, c and d clusters, on L and S chromosomes. even-skipped genes (evx1 or evx2) are positioned flanking hoxa and hoxd clusters. hox genes are classified into four groups namely, labial, proboscipedia, central and posterior groups. Note that hoxb2.L (2p, black) is a pseudogene. d, Syntenies around the mix gene family. Abbreviations for species and chromosome numbers: HSA1, H. sapiens;; GGA3 G. gallus (chicken); XTR5, X. tropicalis; XLA5L and XLA5S, X. laevisL and S subgenomes); DRE20, D. rerio (zebrafish);. Each Xenopus (sub)genome experienced its own independent expansion of the family (see Extended Data Fig. 5 for details).
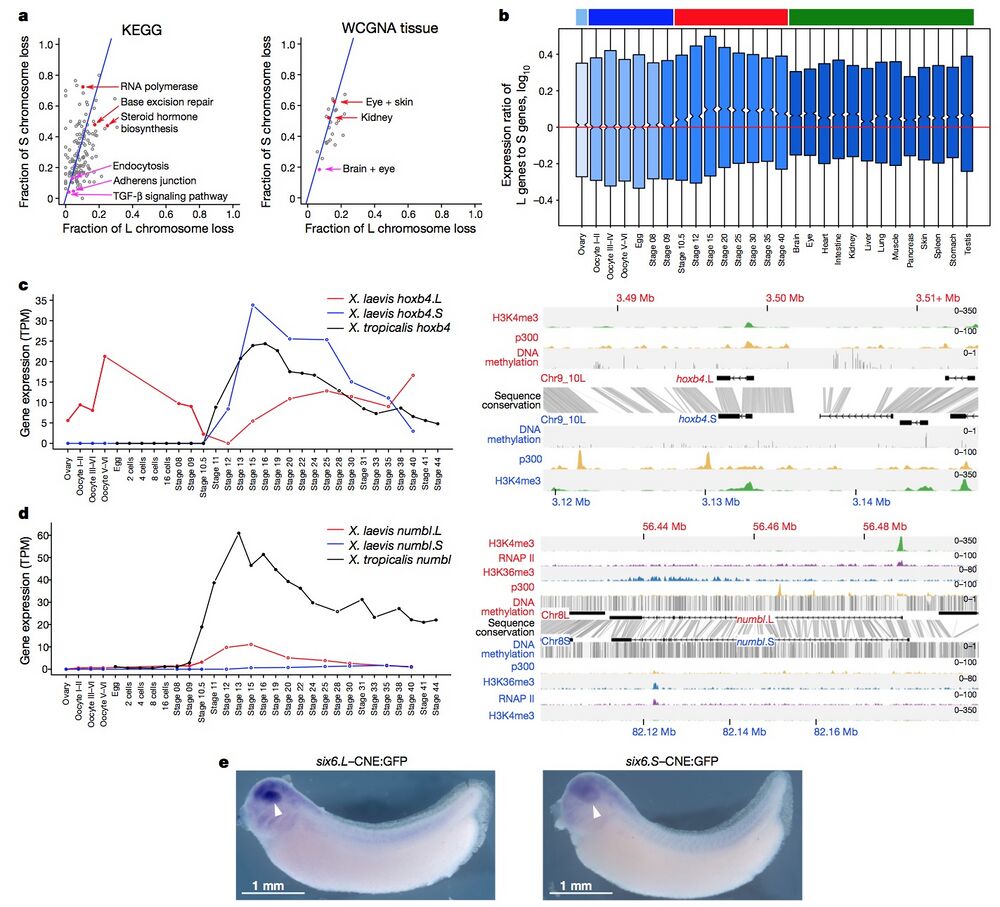
Figure 4 | Retention and functional differentiation. a, Comparison of L and S gene loss by KEGG categories (left) and tissue-weighted gene co-expression network analysis (WGCNA) categories (right) (Supplementary Note 10.1). Blue line denotes expected L or S loss based on genome-wide average (56.4%). Red points denote functional categories showing a high degree of loss. Magenta points denote functional categories showing a high degree of retention (χ2 test, P < 0.01). b, Box plot of log10(LTPM/STPM) for homoeologous gene pairs, zoomed in to show medians. Ovary and maternally controlled developmental time points (left, light blue and dark blue bars, respectively), zygotically controlled developmental time points and adult tissues (right, red and green bars, respectively). Red line, equal ratio log10(1). On average, maternal datasets express the L gene of a homoeologous pair 12% more strongly than the S gene (median = 0%), whereas zygotic tissues and time points express the L gene of a homoeologous pair 25% more strongly than the S gene (median = 1.8%). The difference between the mean and medians is explained by many genes with large differences between homoeologues (Extended Data Fig. 8c). c, d, Developmental expression plot (left) and epigenetic landscape (right) surrounding hoxb4 (c) and numbl (d). Right, genomic profiles of H3K4me3 (green), p300 (yellow), RNA polymerase II (RNAP II; d, purple) and H3K36me3 (d, blue) ChIP–seq tracks, as well as DNA methylation levels determined by whole-genome bisulfite sequencing (grey). Gene annotation track shows hoxb4 (c) and numbl (d) genes on L (top) and S. Grey denotes conservation between L and S genomic sequences. d, The small amount of expression seen in maternal numbl and numbl.L is consistent between replicates. Gene expression is measured in transcripts per million mapped reads (TPM). e, Representative embryos with GFP expression, as detected by in situ hybridization at stages 32–33, driven by six6.L-CNE or six6.S-CNE linked to a basal promoter-GFP cassette (six6.L-CNE:GFP and six6.S-CNE:GFP, respectively). Embryos were 4,250–4,450 μm. Semi-quantitative image analysis revealed a substantial difference in average expression level; the expression driven by six6.S-CNE (n = 27) was 0.6-fold weaker than that by six6.L-CNE in the eye region (n = 32). Given eye-specific patterns of their endogenous expression, the six6 genes probably have additional silencers for restricting enhancer activity of the CNEs in the eye.
Adapted with permission from Macmillan Publishers Ltd: Session et al. (2016).Genome evolution in the allotetraploid frog Xenopus laevis. Nature 538, 336–343 (20 October 2016) doi:10.1038/nature19840, copyright (2016).
This work is licensed under a Creative Commons Attribution 4.0 International License. The images or other third party material in this article are included in the article’s Creative Commons license, unless indicated otherwise in the credit line; if the material is not included under the Creative Commons license, users will need to obtain permission from the license holder to reproduce the material. To view a copy of this license, visit http://creativecommons.org/licenses/by/4.0/
L and S gene loss by KEGG categories (left) and tissue-weighted gene co-expression network analysis (WGCNA) categories (right) (Supplementary Note 10.1). Blue line denotes expected L or S loss based on genome-wide average (56.4%). Red points denote functional categories showing a high degree of loss. Magenta points denote functional categories showing a high degree of retention (χ2 test, P < 0.01). b, Box plot of log10(LTPM/STPM) for homoeologous gene pairs, zoomed in to show medians. Ovary and maternally controlled developmental time points (left, light blue and dark blue bars, respectively), zygotically controlled developmental time points and adult tissues (right, red and green bars, respectively). Red line, equal ratio log10(1). On average, maternal datasets express the L gene of a homoeologous pair 12% more strongly than the
S gene (median = 0%), whereas zygotic tissues and time points express the L gene of a homoeologous pair 25% more strongly than the S gene (median = 1.8%). The difference between the mean and medians is explained by many genes with large differences between homoeologues (Extended Data Fig. 8c). c, d, Developmental expression plot (left) and epigenetic landscape (right) surrounding hoxb4 (c) and numbl (d). Right, genomic profiles of H3K4me3 (green), p300 (yellow), RNA polymerase II (RNAP II; d, purple) and H3K36me3 (d, blue) ChIP–seq tracks, as well as DNA methylation levels determined by whole-genome bisulfite sequencing (grey). Gene annotation track shows hoxb4 (c) and numbl (d) genes on L (top) and S. Grey denotes conservation between L and S genomic sequences. d, The small amount of expression seen in maternal numbl and numbl.L is consistent between replicates. Gene expression is measured in transcripts per million mapped reads (TPM). e, Representative embryos with GFP expression, as detected by in situ hybridization at stages 32–33, driven by six6.L-CNE or six6.S-CNE linked to a basal promoter-GFP cassette (six6.L-CNE:GFP and six6.S-CNE:GFP, respectively). Embryos were 4,250–4,450 μm. Semi-quantitative image analysis revealed a substantial difference in average expression level; the expression driven by six6.S-CNE (n = 27) was 0.6-fold weaker than that by six6.L-CNE in the eye region (n = 32). Given eye-specific patterns of their endogenous expression, the six6 genes probably have additional silencers for restricting enhancer activity of the CNEs in the eye.