In Situ Microprobe Single-Cell Capillary Electrophoresis Mass Spectrometry
In Situ Microprobe Single-Cell Capillary Electrophoresis Mass Spectrometry: Metabolic Reorganization in Single Differentiating Cells in the Live Vertebrate (Xenopus laevis) Embryo.
Anal Chem. 2017 Jul 5;89(13):7069-7076. doi: 10.1021/acs.analchem.7b00880. Epub 2017 May 1.
Onjiko RM, Portero EP, Moody SA, Nemes P.
Abstract
Knowledge of single-cell metabolism would provide a powerful look into cell activity changes as cells differentiate to all the tissues of the vertebrate embryo. However, single-cell mass spectrometry technologies have not yet been made compatible with complex three-dimensional changes and rapidly decreasing cell sizes during early development of the embryo. Here, we bridge this technological gap by integrating capillary microsampling, microscale metabolite extraction, and capillary electrophoresis electrospray ionization mass spectrometry (CE-ESI-MS) to enable direct metabolic analysis of identified cells in the live frog embryo (Xenopus laevis). Microprobe CE-ESI-MS of <0.02% of the single-cell content allowed us to detect ∼230 different molecular features (positive ion mode), including 70 known metabolites, in single dorsal and ventral cells in 8-to-32-cell embryos. Relative quantification followed by multivariate and statistical analysis of the data found that microsampling enhanced detection sensitivity compared to whole-cell dissection by minimizing chemical interferences and ion suppression effects from the culture media. In addition, higher glutathione/oxidized glutathione ratios suggested that microprobed cells exhibited significantly lower oxidative stress than those dissected from the embryo. Fast (5 s/cell) and scalable microsampling with minimal damage to cells in the 8-cell embryo enabled duplicate and triplicate metabolic analysis of the same cell, which surprisingly continued to divide to the 16-cell stage. Last, we used microprobe single-cell CE-ESI-MS to uncover previously unknown reorganization of the single-cell metabolome as the dorsal progenitor cell from the 8-cell embryo formed the neural tissue fated clone through divisions to the 32-cell embryo, peering, for the first time, into the formation of metabolic single-cell heterogeneity during early development of a vertebrate embryo.
View article at Analytical Chemistry.
View article on Pubmed.
____________________________________________________________
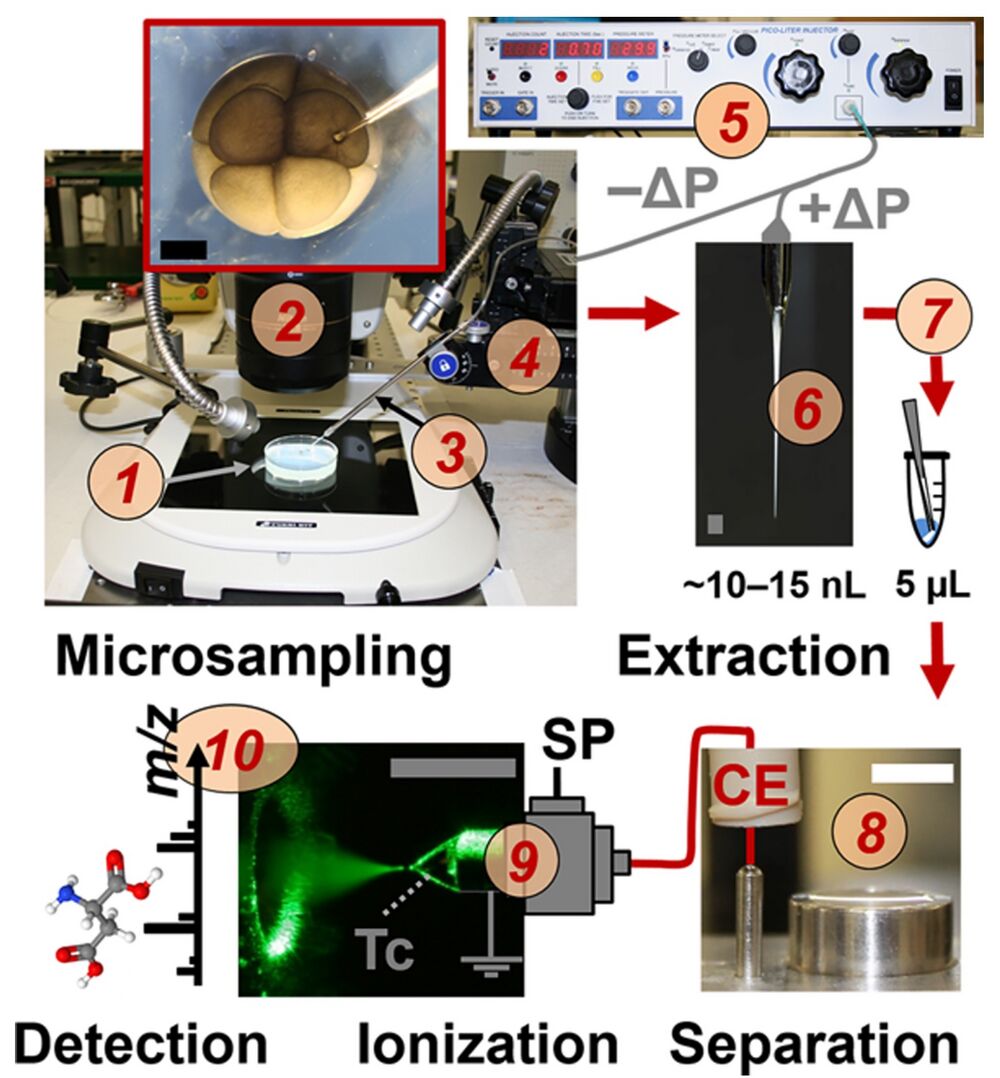
Figure 1. Microprobe single-cell capillary electrophoresis (CE) mass spectrometry (MS) enabling in situ metabolic characterization of live Xenopus laevis embryos (1). A 10−15 nL portion of single cells identified under a stereomicroscope (2) were aspirated into a pulled capillary (3) using a multiaxis translation stage (4) and a microinjector (5) delivering vacuum (−ΔP). The collected cell content (6) was pressure-injected (+ΔP) into a vial for metabolite extraction (7). The extract was measured by a microloading CE platform (8) connected to a CE electrospray ionization (ESI) source (9) operated in the cone-jet mode (see Taylor-cone, Tc). Metabolite ions were identified and quantified using a high-resolution tandem mass spectrometer (10). Scale bars = 500 μm (dark/gray); 10 mm (white). Key: SP, syringe pump.
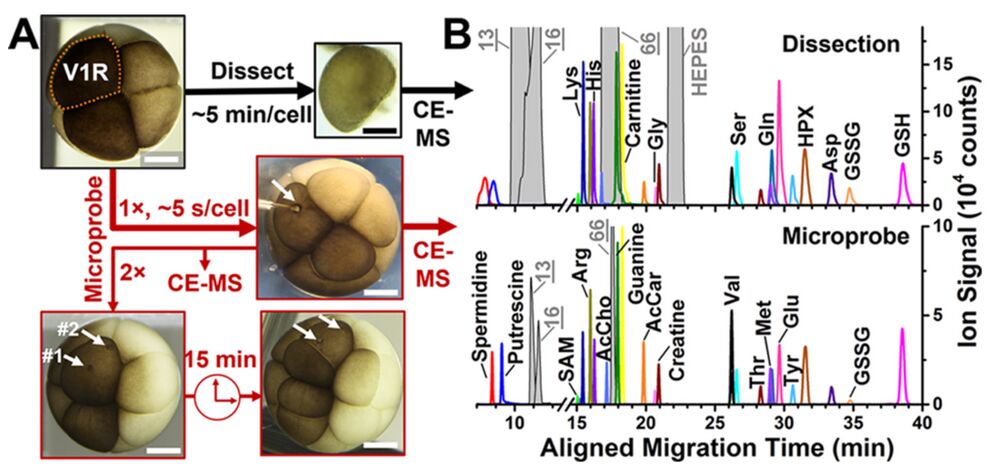
Figure 2. Metabolite detection by microprobe CE-ESI-MS vs whole- cell dissection. (A) As reference, the whole right-ventral (V1R) cell was dissected from the 8-cell X. laevis embryo. In comparison, the V1R cell was analyzed once (1×) and twice (2×) in the live embryo using the microprobe (spots mark analysis locations; see white arrows). Intriguingly, microprobed cells divided to form the 16-cell embryo. (B) Electropherograms exemplifying metabolites identified in a V1R cell using whole-cell dissection (top panel) and microsampling (bottom panel). Scale bars = 250 μm. Key: HPX, hypoxanthine; SAM, S-adenosylmethionine; AcCho, acetylcholine; AcCar, acetylcar- nitine. Peaks in gray correspond to compounds from the embryo culture media. See detected molecular features and metabolite identifications in Table S1.
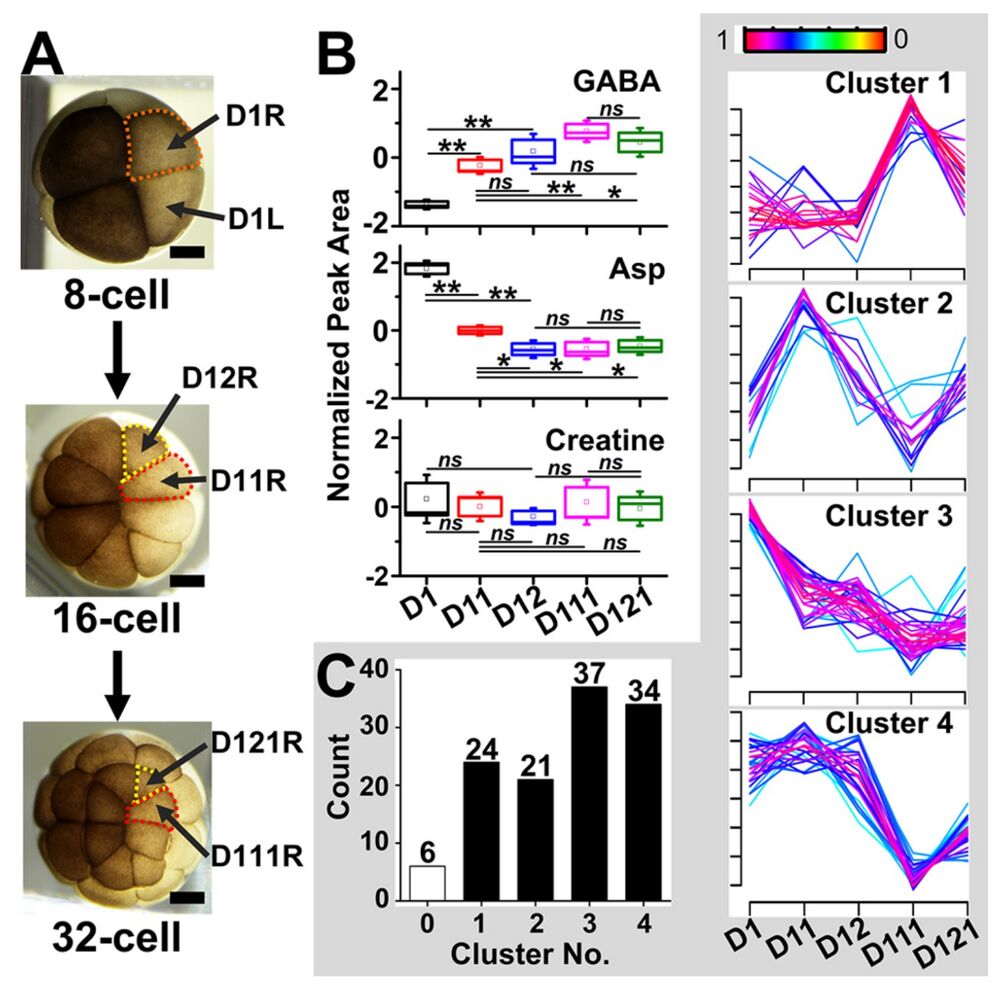
Figure 4. Single-cell metabolism in the dorsal cell lineage of the X. laevis embryo. (A) Optical images of the progenitor right dorsal (D1R) cell, its daughter cells, the D11R and D12R cells, which then respectively are precursors to animal pole D111R and D121R cells. (B) Fisher’s least discriminant analysis finding significant metabolic changes between cells in the lineage. Key: *P < 0.05; **P < 0.001; ns = no significant difference. (C) Unsupervised fuzzy-c means clustering of single-cell metabolite profiles between cells in the clone. See molecular features and their cluster assignments in Table S4. Scale bars = 250 μm.
Adapted with permission from Onjiko et al. In Situ Microprobe Single-Cell Capillary Electrophoresis Mass Spectrometry: Metabolic Reorganization in Single Differentiating Cells in the Live Vertebrate (Xenopus laevis) Embryo. Anal Chem. 2017 Jul 5;89(13):7069-7076. doi: 10.1021/acs.analchem.7b00880. Epub 2017 May 1. Copyright 2017 American Chemical Society.