GSK3 Inhibits Macropinocytosis and Lysosomal Activity through the Wnt Destruction Complex Machinery
Albrecht LV, Tejeda-Muñoz N, Bui MH, Cicchetto AC, Di Biagio D, Colozza G, Schmid E, Piccolo S, Christofk HR, De Robertis EM.
Cell Rep July 28, 2020; 32 (4): 107973.
Click here to view article at Cell Reports.
Click here to view article on Pubmed.
Click here to view article on Xenbase.
Highlights
• GSK3 and Axin1 normally repress macropinocytosis in basal cellular conditions
• GSK3 inhibition or Axin1 mutation triggers macropinocytosis and metabolite changes
• Macropinocytosis induces acidification and catabolic activity of lysosomes
• Lysosomal activation by Wnt signaling is independent of new protein synthesis
Abstract
Canonical Wnt signaling is emerging as a major regulator of endocytosis. Here, we report that Wnt-induced macropinocytosis is regulated through glycogen synthase kinase 3 (GSK3) and the β-catenin destruction complex. We find that mutation of Axin1, a tumor suppressor and component of the destruction complex, results in the activation of macropinocytosis. Surprisingly, inhibition of GSK3 by lithium chloride (LiCl), CHIR99021, or dominant-negative GSK3 triggers macropinocytosis. GSK3 inhibition causes a rapid increase in acidic endolysosomes that is independent of new protein synthesis. GSK3 inhibition or Axin1 mutation increases lysosomal activity, which can be followed with tracers of active cathepsin D, β-glucosidase, and ovalbumin degradation. Microinjection of LiCl into the blastula cavity of Xenopus embryos causes a striking increase in dextran macropinocytosis. The effects of GSK3 inhibition on protein degradation in endolysosomes are blocked by the macropinocytosis inhibitors EIPA or IPA-3, suggesting that increases in membrane trafficking drive lysosomal activity.
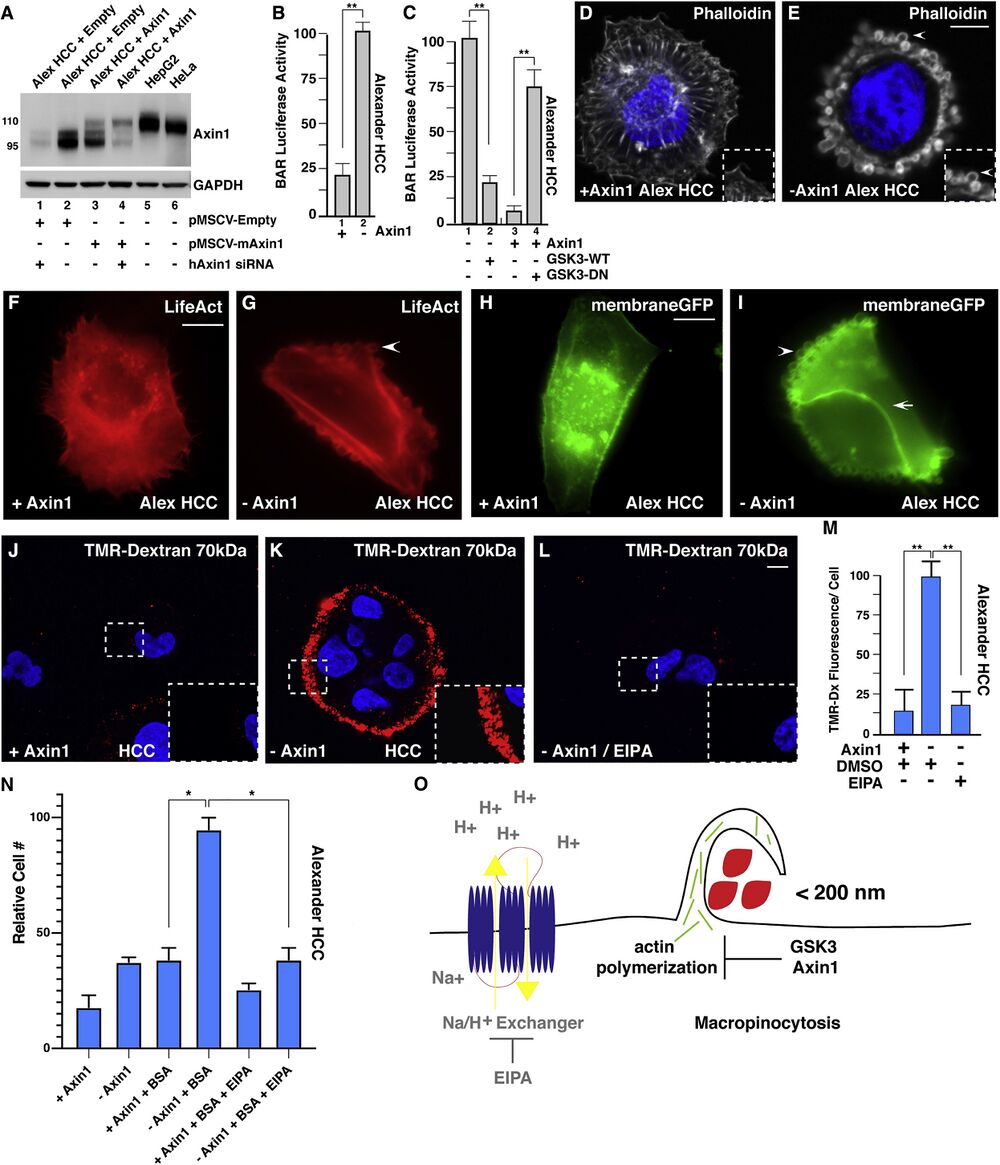
Figure 1
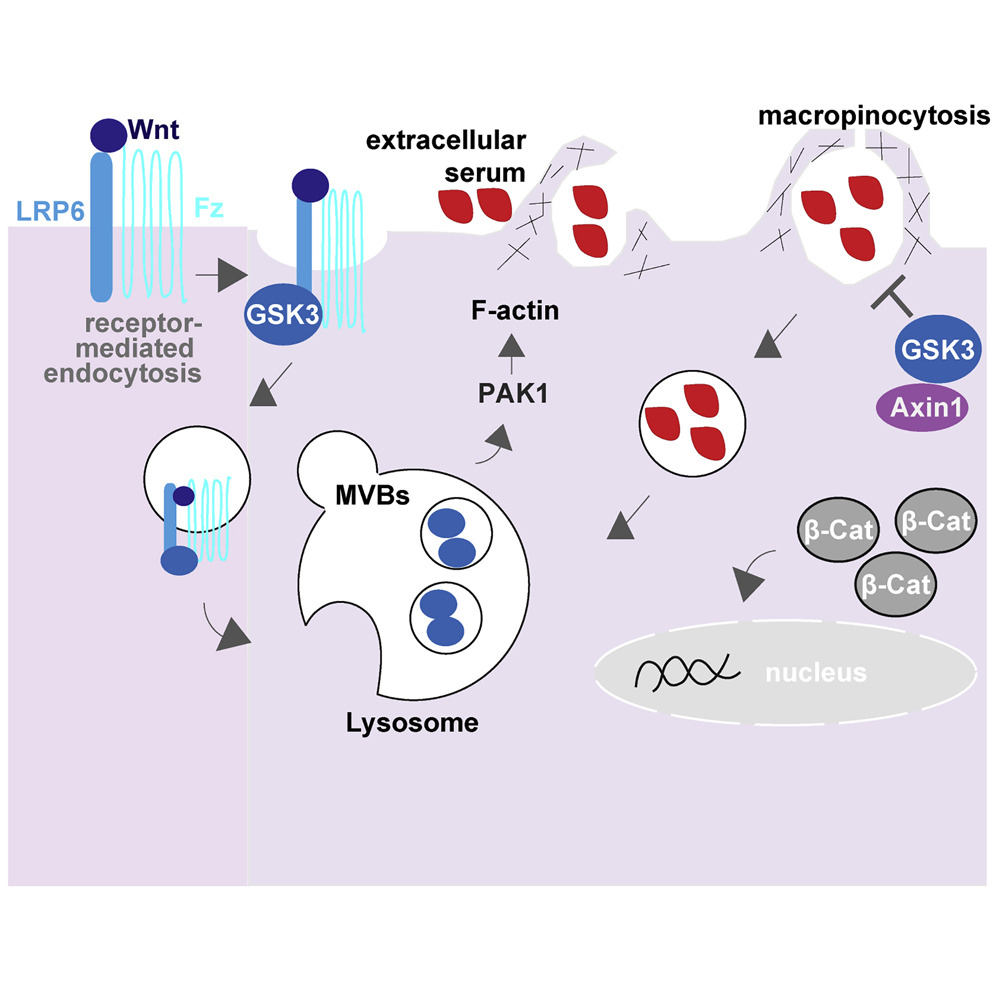
Axin1 Mutation Causes Increased Macropinocytosis in Alexander HCC Cells, as Revealed by Axin Reconstitution. (A) Axin1 protein expression levels assessed after transduction with pMSCV-empty vector (lanes 1 and 2), pMSCV mouse Axin1 in Alexander hepatocellular carcinoma (HCC) cells (lanes 3 and 4), or in HepG2 and HeLa cells (lanes 5 and 6). Alexander cells express an endogenous form of Axin1 that is shorter than the full-length protein (110 kDa) due to the deletion of exon 4 (95 kDa), which is the region that interacts with GSK3 (Satoh et. al., 2000). To show that the lower band was indeed Axin1, cells were transfected with human siRNA that spares mouse Axin1 mRNA (lanes 1 and 4). Note that the expression levels of reconstituted Axin1 were lower than those of the smaller protein skipping exon 4 in Alexander cells or those of endogenous full-length Axin1 in HepG2 or HeLa cells, indicating that Axin1 levels were within the physiological range. (B) Axin1 mutant cells showed increased β-catenin activity reporter (BAR- Luciferase, relative to Renilla), in Alexander cells, when compared to Axin1 reconstituted cells. (C) Wild-type (WT) GSK3-GFP transfection in Axin1-mutated HCC cells decreased BAR-Luciferase activity relative to Renilla in Alexander minus Axin1 cells, while dominant-negative GSK3 (GSK3-DN) expression was sufficient to increase BAR- Luciferase activity in Axin1-reconstituted cells. (D) Axin1-reconstituted HCC cells displayed actin stress fibers visualized by phalloidin F-actin staining. (E) Axin1-mutated HCC cells had extensive cortical actin remodeling with large vesicular structures (arrowhead), visualized by phalloidin. (F) LifeAct F-actin imaging showing actin stress fibers in Axin1-reconstituted HCC cells (see also Movie S1). (G) Axin1-mutant HCC cells showed macropinosome-like structures by LifeAct F-actin imaging (see also Movie S1). (H) MembraneGFP transfected Axin1-reconstituted Alexander HCC cells. (I) Axin1-mutated HCC cells led to dynamic membrane remodeling (arrowhead) and vesicle formation in the apical plasma membrane while not between neighboring cells (arrow) visualized by membraneGFP. H and I represent still images from Movie S2. (J) Axin1-reconstituted HCC cells do not increase uptake of TMR-dextran (dx) 70 kDa. (K) Axin1 mutated cells have high levels of TMR-dx marking macropinocytosis. Inset shows higher magnifications to reveal macropinosomes. (L) TMR-dx uptake is sensitive EIPA treatment in Axin1-mutated cells. (M) Quantification of increased TMR-dx uptake in Axin1-mutated cells compared to Axin1-reconstituted cells or with treatment with EIPA. See also Figure S1. Error bars denote SEM (n ≥ 3), (∗p > 0.05, ∗∗p > 0.01) in biological replicates. Scale bars, 10 μm. (N) Mutation of Axin1 allowed growth of HCC cells in the absence of serum and Glutamine at the expense of 3% BSA in an EIPA-dependent manner (brackets). Alexander HCC cells ±Axin1 were grown in serum-starved medium for three days and the increase in numbers of viable cells counted by trypan blue exclusion assay. The results are consistent with the view that mutation of Axin1 increases cell nutrition through macropinocytosis. (O) Model showing that macropinocytosis incorporation of extracellular macromolecules is repressed in basal cell conditions by a complex of Axin1 and GSK3, the loss of either one results in actin remodeling and massive macropinocytosis of macromolecules (red) in a process that relies on Na+/H+ exchangers which are the target of the macropinocytosis inhibitor EIPA.
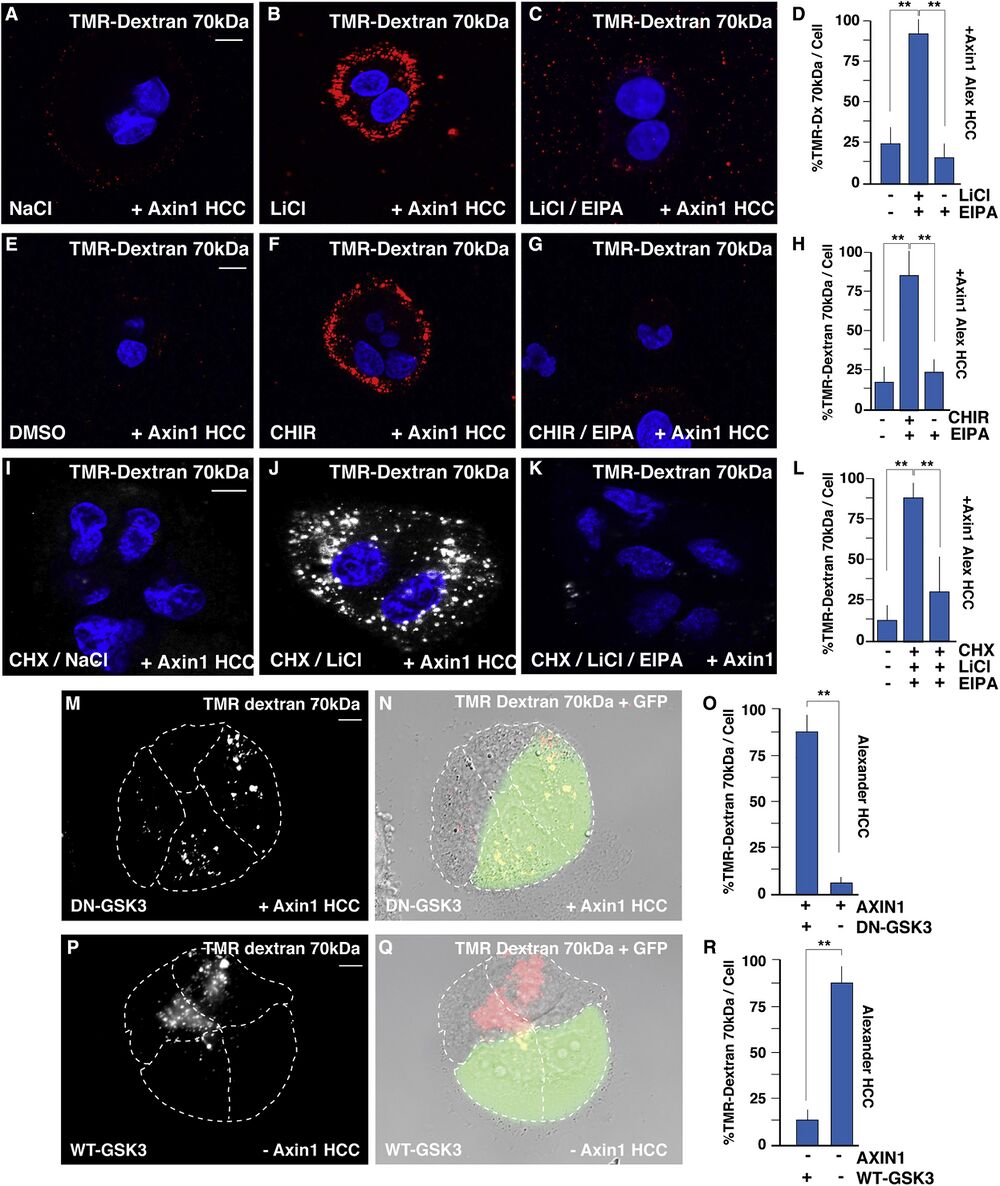
Figure 2
GSK3 Inhibition Increases Macropinocytosis Even in the Absence of Protein Synthesis (A) Axin1-reconstituted HCC cells treated with NaCl and stained with TMR-dx 70 kDa. (B) Axin1-reconstituted HCC cells treated with GSK3 inhibitor, LiCl, increased TMR-dx uptake after 20 min. (C) Axin1-reconstituted HCC cells treated with EIPA decreased TMR-dx uptake by LiCl. (D) Quantification of LiCl induced TMR-dx uptake in Axin1-reconstituted HCC cells. (E) Axin1-reconstituted HCC cells treated with DMSO and stained with TMR-dx. (F) Axin1-reconstituted HCC cells treated with GSK3 inhibitor, CHIR, increased TMR uptake after 20 min. (G) Axin1-reconstituted HCC cells treated with EIPA decreased TMR-dx uptake by CHIR. (H) Quantification of CHIR induced TMR-dx uptake in Axin1-reconstituted HCC cells. (I) Axin1-reconstituted HCC cells treated NaCl stained with TMR-dx in the absence of new protein synthesis blocked by cycloheximide (20 μg/ml CHX). (J) Axin1-reconstituted HCC cells treated with LiCl and stained with TMR-dx treated with CHX (4 h). (K) Axin1-reconstituted HCC cells treated LiCl, CHX, and EIPA stained with TMR-dx. (L) Quantification of LiCl induced TMR-dx uptake in Axin1-reconstituted HCC cells in the presence of CHX. (M) Dominant-negative GSK3-GFP (DN-GSK3-GFP) induced macropinocytic TMR-dx uptake in Axin1 transfected HCC cells, compared to nontransfected neighboring cells. (N) DN-GSK3-GFP expression with TMR-dx uptake and DIC phase contrast in Axin1 transfected HCC cells. (O) Quantification of DN-GSK3-GFP-induced macropinocytic TMR-dx uptake in Axin1 transfected HCC cells, compared to nontransfected neighboring cells. (P) Wild-type (WT) GSK3-GFP inhibited TMR-dx uptake in transfected minus Axin1 HCC cells, compared to nontransfected neighboring cells. (Q) WT-GSK3-GFP expression with TMR-dx uptake and DIC phase contrast in Axin1transfected HCC cells. (R) Quantification of TMR-dx uptake in Axin1 transfected WT-GSK3-GFP HCC cells, compared to nontransfected neighboring cells. Experiments represent biological replicates. Error bars denote SEM (n ≥ 3) (∗∗p > 0.01). Scale bars, 10 μm. See also Figure S2.
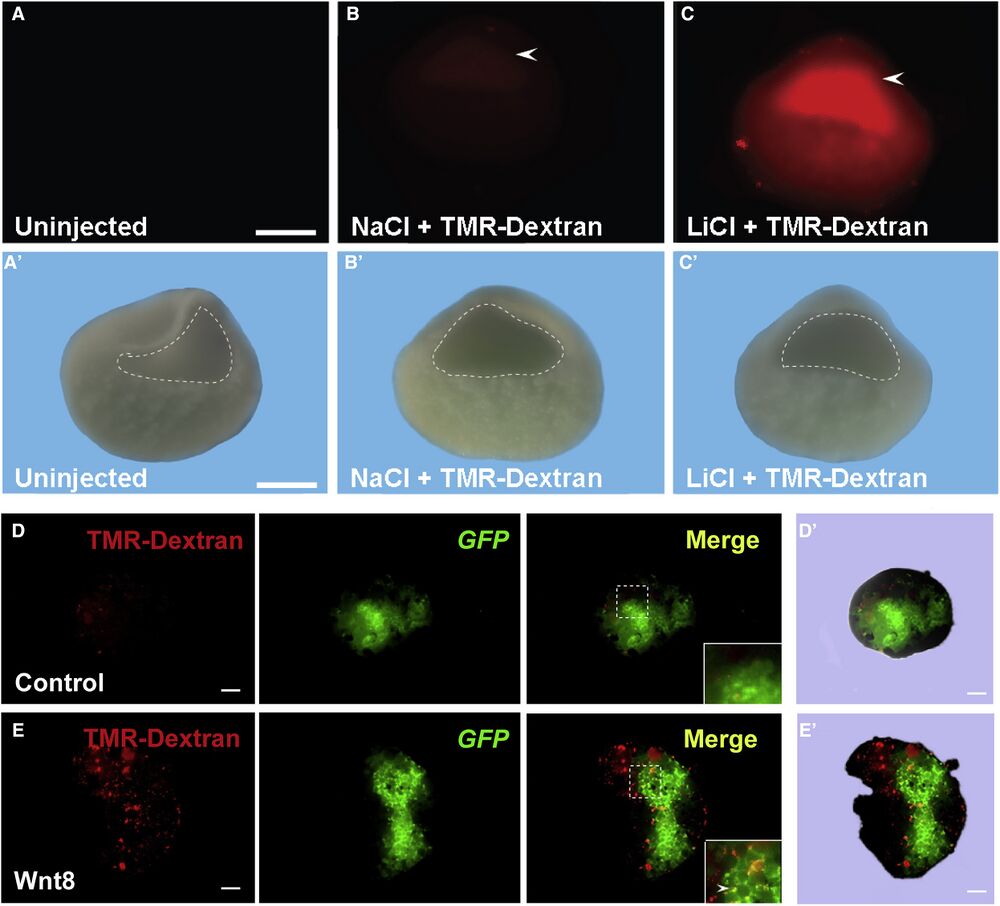
Figure 3
In Vivo Inhibition of GSK3 by LiCl Microinjection Causes Increased Macropinocytosis in the Blastula Cavity (A) Uninjected Xenopus embryos had no detectable fluorescence at blastula (n = 44). (A′) Blastocoel in uninjected embryos delineated in the visible light image. (B) Controls injected with NaCl did not activate macropinocytosis (n = 127; 27% of half-embryos had small fluorescent spots of damaged cells but lacked uniform staining). Embryos were injected at midblastula and cultured for one hour before fixation and bisection. (B′) Blastocoel in NaCl injected embryos delineated in the visible light image. (C) LiCl microinjection at midblastula stage increased TMR-dx 70 kDa uptake in blastocoel-lining cells in Xenopus embryos (n = 111 half-embryos, 78% with uniformly increased macropinocytosis in the blastocoel, 2 independent experiments). (C′) Blastocoel in LiCl injected embryos delineated in the visible light image. Scale bar, 0.35 mm. (D) Ectodermal explant from a control embryo microinjected into one blastomere with 300 pg mGFP mRNA at the four-cell stage, cultured until late blastula (stage 8.5), and incubated with 1 mg/mL of TMR-dx for 1hr in Steinberg’s solution (n = 13). Note the lack of macropinocytic puncta. (D′) Contour of the ectodermal explant in control embryo in visible light. (E) Ectodermal explant co- injected with 10 pg of xWnt8 and mGFP mRNAs and incubated for 1 h with TMR-dx. Note that xWnt8 mRNA stimulates macropinocytosis of TMR-dx in distinct puncta in cells injected with mRNA and in the immediate surrounding cells (n = 20). (E′) Contour of the ectodermal explant in xWnt8 injected embryo in visible light. Scale bars, 10 μm.
Adapted with permission from Elsevier on behalf of Cell Reports: Albrecht et al. (2020). GSK3 Inhibits Macropinocytosis and Lysosomal Activity through the Wnt Destruction Complex Machinery. Cell Rep July 28, 2020; 32 (4): 107973. DOI:https://doi.org/10.1016/j.celrep.2020.107973
This work is licensed under a Creative Commons Attribution 4.0 International License. The images or other third party material in this article are included in the article’s Creative Commons license, unless indicated otherwise in the credit line; if the material is not included under the Creative Commons license, users will need to obtain permission from the license holder to reproduce the material. To view a copy of this license, visit http://creativecommons.org/licenses/by/4.0/
Last Updated: 2020-08-19