High variability of expression profiles of homeologous genes for Wnt, Hh, Notch, and Hippo signaling pathways in Xenopus laevis
Dev Biol. September 28, 2016,
Michiue T, Yamamoto T, Yasuoka Y, Goto T, Ikeda T, Nagura K, Nakayama T, Taira M, Kinoshita T.
Click here to view this article on Developmental Biology
Click here to view this article on Pubmed
Click here to view this article on Xenbase
Abstract
Cell signaling pathways, such as Wnt, Hedgehog (Hh), Notch, and Hippo, are essential for embryogenesis, organogenesis, and tissue homeostasis. In this study, we analyzed 415 genes involved in these pathways in the allotetraploid frog, Xenopus laevis. Most genes are retained in two subgenomes called L and S (193 homeologous gene pairs and 29 singletons). This conservation rate of homeologs is much higher than that of all genes in the X. laevis genome (86.9% vs 60.2%). Among singletons, 24 genes are retained in the L subgenome, a rate similar to the average for all genes (82.8% vs 74.6%). In addition, as general components of signal transduction, we also analyzed 32 heparan sulfate proteoglycan (HSPG)-related genes and eight TLE/Groucho transcriptional corepressors-related genes. In these gene sets, all homeologous pairs have been retained. Transcriptome analysis using RNA-seq data from developmental stages and adult tissues demonstrated that most homeologous pairs of signaling components have variable expression patterns, in contrast to the conservative expression profiles of homeologs for transcription factors. Our results indicate that homeologous gene pairs for cell signaling regulation have tended to become subfunctionalized after allotetraploidization. Diversification of signaling pathways by subfunctionalization of homeologs may enhance environmental adaptability. These results provide insights into the evolution of signaling pathways after polyploidization.
  ,
 ,
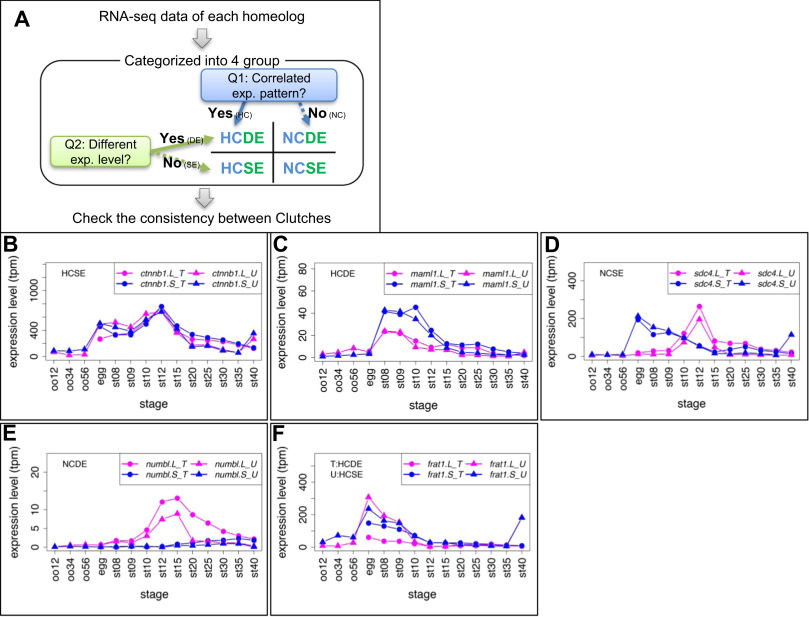
Fig. 1. Criteria and examples of transcriptome correlation analysis. (A) Criteria for categorization of homeologous gene expression. See Materials and Methods for details. All results are presented in Suppl. Data3. (B-E) Examples of four groups. Group names are presented in each graph. In case of inconsistencies, group names in different clutches are presented separately. (B) ctnnb1.L (&beta,-catenin.L) and ctnnb1.S (&beta,-catenin.S) showed quite similar expression patterns (HCSE). (C) maml1.L showed highly correlated, but stronger expression than maml1.S throughout developmental stages (st8-12) (HCDE). (D) sdc4.L and sdc4.S showed different expression patterns during development (NCSE). (E) numbl. L showed stronger expression than numbl.S and the two expression patterns are quite different throughout developmental stages. (F) An example of inconsistent categories between clutches. frat1.S was expressed at higher levels than frat1.L during development in Clutch T (HCDE), but both showed similar expression levels in Clutch U (HCSE). Line graphs show expression levels of genes during oogenesis and embryogenesis. Magenta, L genes, Blue, S genes, circles, Clutch T, triangles, Clutch U.
  ,
 ,
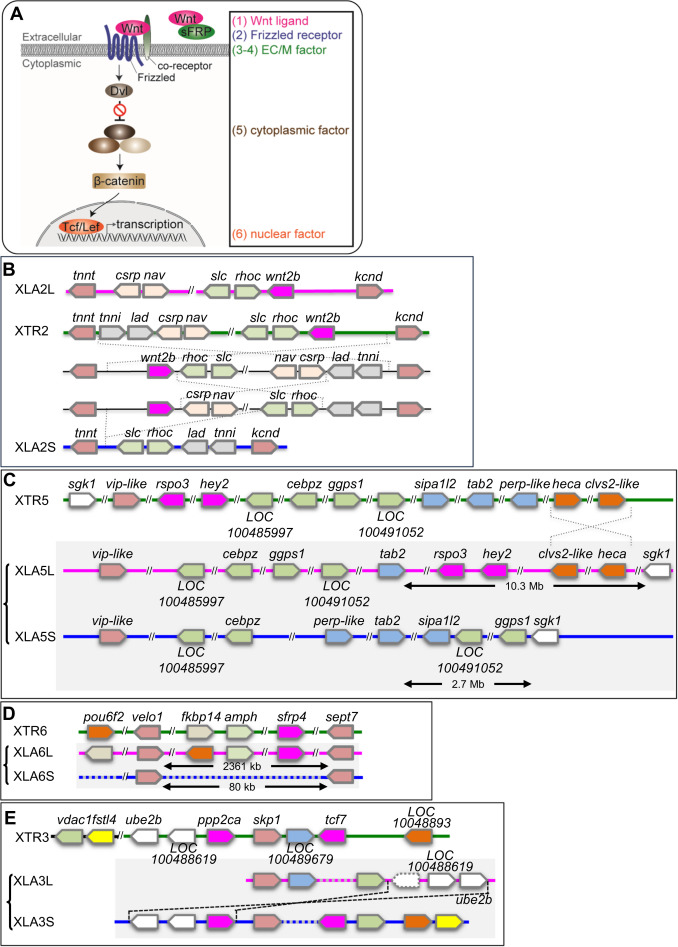
Fig. 2. Syntenic analyses of Wnt signaling-related singletons inX. laevisandX. tropicalis. (A) Schematic view of the Wnt signaling pathway. Categories based on subcellular localization are indicated at the right. (B) Synteny around wnt2b. XLA2L retains conserved synteny around wnt2b with X. tropicalis chromosome 2 (XTR2), but several rearrangements may have occurred in XLA2S. (C) Synteny around rspo3. Complicated rearrangements were observed on both L and S chromosomes. (D) Comparison of sfrp4 loci. sfrp4.S was lost in a large deletion (~23 Mb) between velo1 and sept7 on XLA6S. (E) Comparison of genomic loci surrounding ppp2ca and tcf7. XLA3S retains conserved synteny with XTR3, even though LOC100489679 was deleted. On the other hand, XLA3L lost tcf7 and there was a large inversion close to vdac1.L. In addition, a pseudogene of ppp2ca.L, shown with a dashed box, was found between vdac1.L and LOC100488619.L. Magenta boxes show singletons involved in Wnt signaling, except hey2 in (C), which is related to Notch signaling. Double diagonal lines indicate a large gap between genes. Diagonal lines on the genome signify deletion of genes. Dashed lines represent putative inversion events. In each panel, only representative gene models are shown for comparison.
  ,
 ,
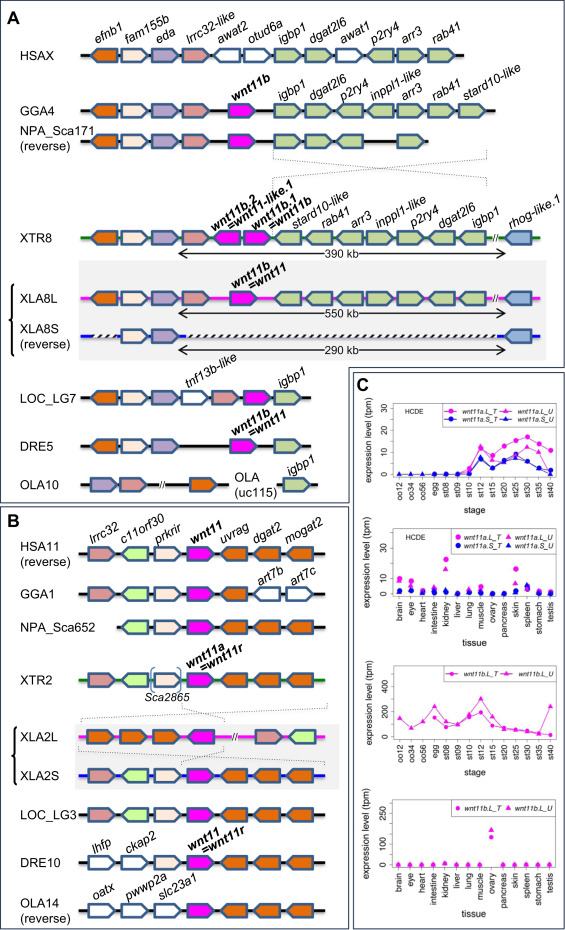
Fig. 3. Frequent loss ofwnt11bgenes in vertebrate lineages and variable expression patterns ofwnt11ahomeologs. (A) Synteny around the wnt11b gene in vertebrates. wnt11b.S was deleted from X. laevis chromosome 8S (XLA8S) together with neighboring genes. Orthologs of wnt11b were also deleted in humans (HSAX) and medaka (OLA10). After the divergence of Xenopus and Nanorana, a large inversion seems to have occurred between igbp1 and stard10-like, as indicated by dashed lines. (B) Synteny around the wnt11a gene in vertebrates. Although a genomic rearrangement was found in XLA2L, wnt11a orthologs and synteny are highly conserved among vertebrates. HSA, Homo sapiens, GGA, Gallus gallus (chicken), NPA, Nanorana parkeri (Tibetan frog), XTR, Xenopus tropicalis, XLA, Xenopus laevis, LOC, Lepisosteus oculatus (spotted gar), DRE, Danio rerio (zebrafish), OLA, Oryzias latipes (medaka). (C) Expression profiles of wnt11a.L, wnt11a.S and wnt11b.L. Data are shown in graphs similar to those in Fig. 1. See text for detailed explanations of variable expression profiles.
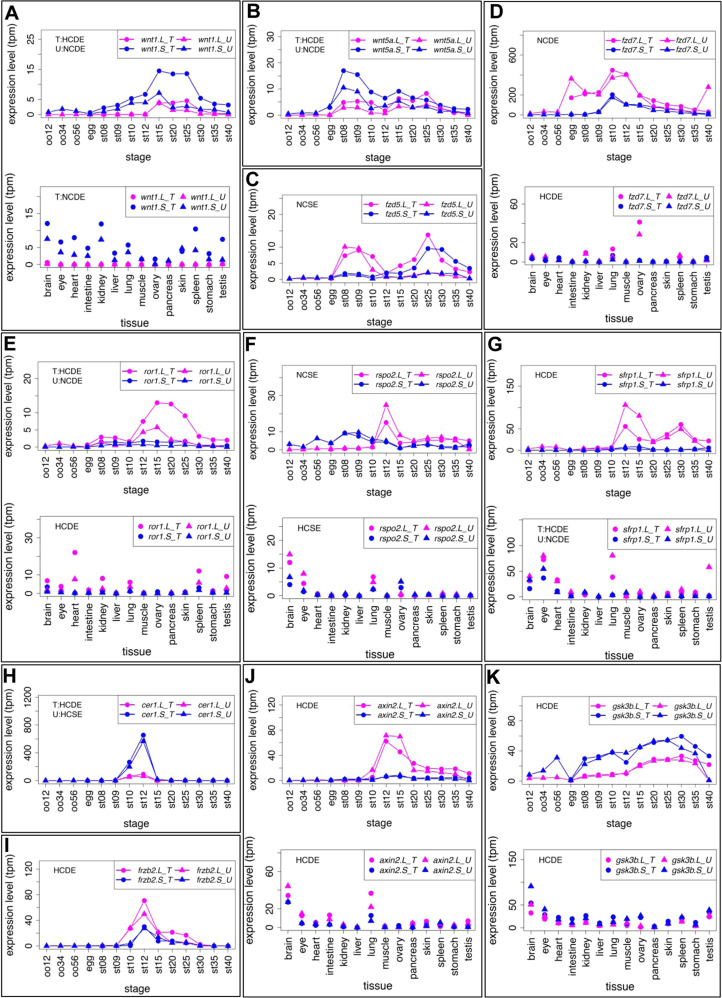
Fig. 4. Variable expression profiles of Wnt signaling-components (Wnt ligands, Frizzled receptors, other extracellular/membrane factors, and cytoplasmic factors). (A-K) Variable expression profiles of Wnt signaling components. Data are shown in graphs similar to those in Fig. 1. See text for detailed explanations of variable expression profiles.
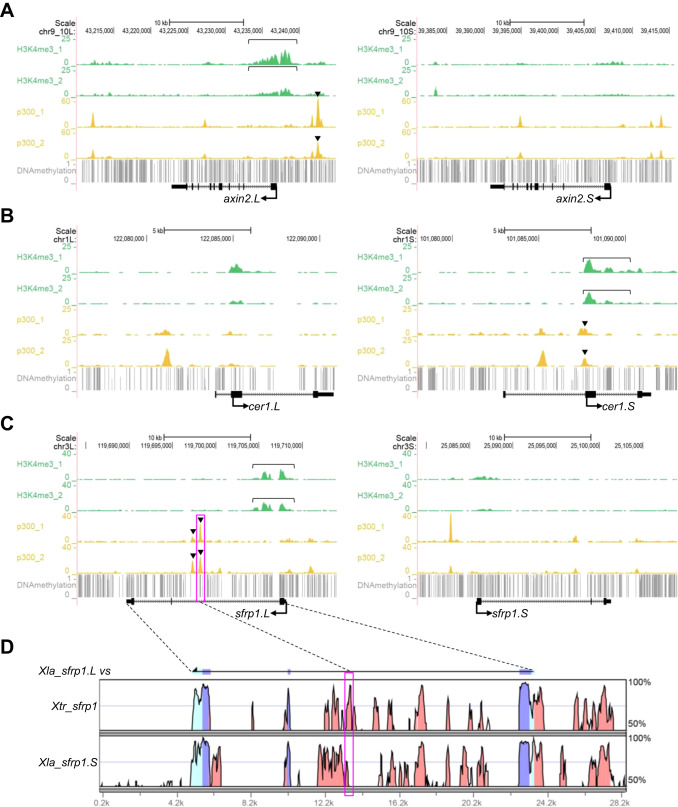
Fig. 5. Correlations of epigenetic states and variable expression profiles. (A-C) Genome browser representations of ChIP-seq and DNA methylation data using X. laevis gastrula embryos (st10.5) demonstrated biased enrichment of H3K4me3 and p300 between homeologous genomic regions near axin2, cer1, and sfrp1. ChIP-seq results from biological replicates are shown separately. Green, H3K4me3, yellow, p300, gray, DNA methylation, bracket, strong enrichment of H3K4me3 on the promoter of the more strongly expressed homeolog, arrowhead, strong enrichment of p300 on enhancers of the more strongly expressed homeolog. (D) A vista plot represents sequence conservation in the genomic region around sfrp1 in X. laevis and X. tropicalis. The sequence of sfrp1.L was used as a reference. Light blue, UTR, dark blue, coding sequences, orange, conserved non-coding sequences. Dashed lines and magenta boxes in (C) and (D) correspond to each other.
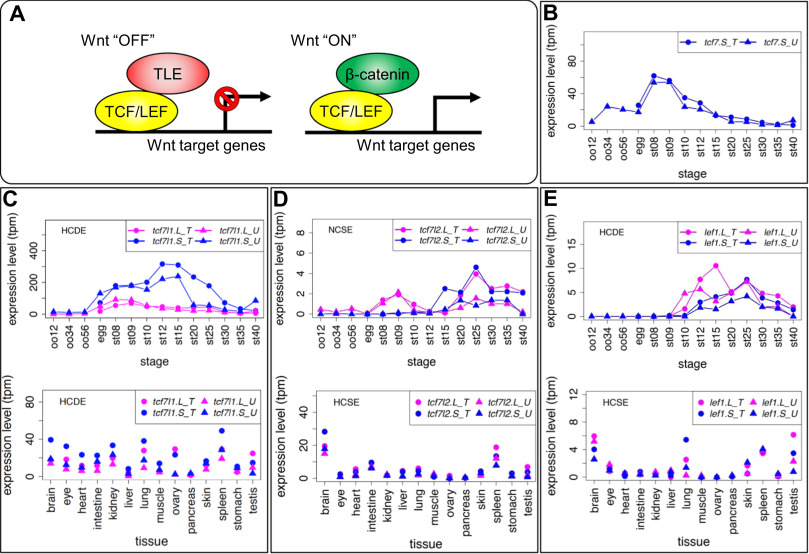
Fig. 6. Variable expression patterns of Tcf/Lef genes. (A) Schematic drawing of transcriptional regulation for Wnt target genes by Tcf/Lef. The Tcf family has a &beta,-catenin-binding domain and a TLE/Groucho-binding domain in addition to the HMG box DNA-binding domain. When canonical Wnt signaling is off, Tcf protein represses target genes by forming a complex with TLE transcriptional corepressors. When canonical Wnt signaling is activated, &beta,-catenin accumulates in the nucleus, Tcf forms a complex with &beta,-catenin, and recruits other coactivators for transcription of target genes. (B-E) Expression profiles of tcf/lef genes. Data are shown in graphs similar to those in Fig. 1. See text for detailed explanations of variable expression profiles.
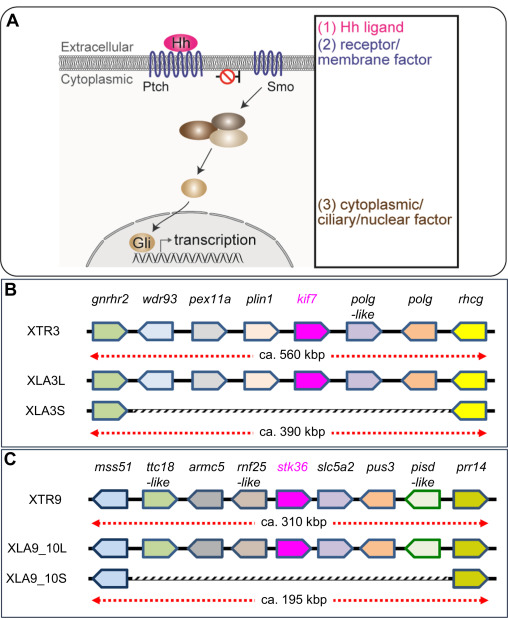
Fig. 7. Schematic view of Hh signaling and syntenic analyses of its singletons. (A) Overview of the Hedgehog (Hh) signaling pathway. Categories based on subcellular localization are indicated at the right. (B-C) A schematic comparison of syntenies around kif7 (B) and stk36 (C) in X. tropicalis and X. laevis. Only representative gene models are listed for comparison. Regions where corresponding gene models are missing on S chromosomes are outlined in gray.
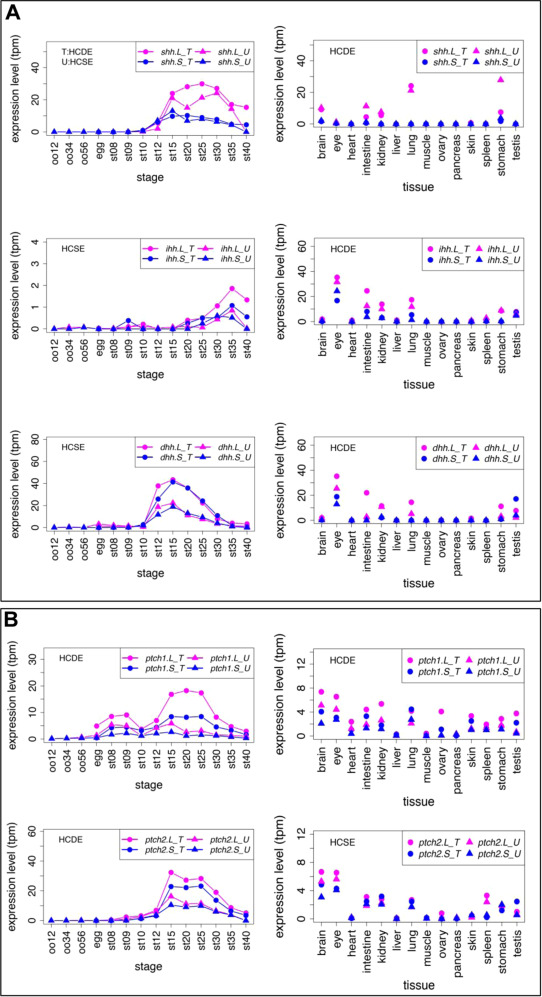
Fig. 8. Variable expression profiles of Hh ligands and Ptch receptors. (A) Expression profiles of Hh ligands. (B) Expression profiles of Ptch receptors. Transcriptomic data are shown in graphs similar to those in Fig. 1. See text for detailed explanations of differential expression.
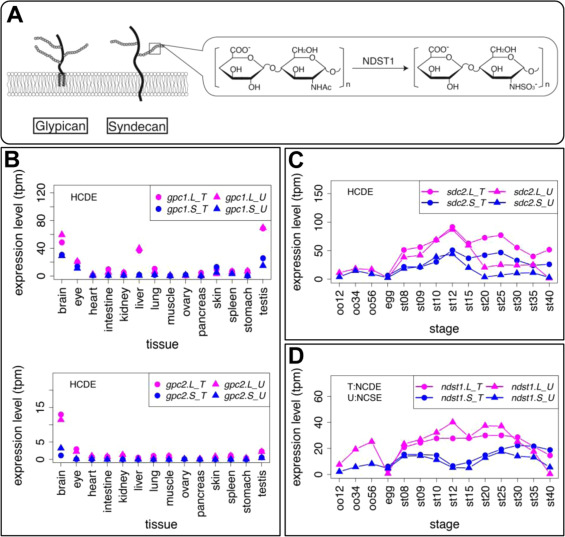
Fig. 9. Genes involved in heparan sulfate proteoglycans also showed variable expression profiles. (A) Schematic diagram of Glypican (Gpc) and Syndecan (Sdc). Solid lines and branches show core protein and glycosaminoglycan chains, respectively. N-deacetylase/N-sulfotransferase (NDST) removes N-acetyl groups from GlcNAc of nascent sugar chains (N-acetyl heparosan) and substitutes the free amino group with sulfate (N-sulfo HS). (B-D) Expression profiles of gpc1, gpc2, sdc4, and ndst1. Transcriptomic data are shown in graphs similar to those in Fig. 1. See text for detailed explanations of variable expression.
 ,
Reproduced with permission by Elsevier, copyright 2017.
Last Updated: 2017-02-10