Sorting at embryonic boundaries requires high heterotypic interfacial tension
Nat Commun. July 31, 2017; 8 (1): 157.
Canty L, Zarour E, Kashkooli L, François P, Fagotto F.
Click here to view article at Nature Communications.
Click here to view article on Pubmed.
Click here to view article on Xenbase.
Abstract
The establishment of sharp boundaries is essential for segregation of embryonic tissues during development, but the underlying mechanism of cell sorting has remained unclear. Opposing hypotheses have been proposed, either based on global tissue adhesive or contractile properties or on local signalling through cell contact cues. Here we use ectoderm-mesoderm separation in Xenopus to directly evaluate the role of these various parameters. We find that ephrin-Eph-based repulsion is very effective at inducing and maintaining separation, whereas differences in adhesion or contractility have surprisingly little impact. Computer simulations support and generalise our experimental results, showing that a high heterotypic interfacial tension between tissues is key to their segregation. We propose a unifying model, in which conditions of sorting previously considered as driven by differential adhesion/tension should be viewed as suboptimal cases of heterotypic interfacial tension.The mechanisms that cause different cells to segregate into distinct tissues are unclear. Here the authors show in Xenopus that formation of a boundary between two tissues is driven by local tension along the interface rather than by global differences in adhesion or cortical contractility.
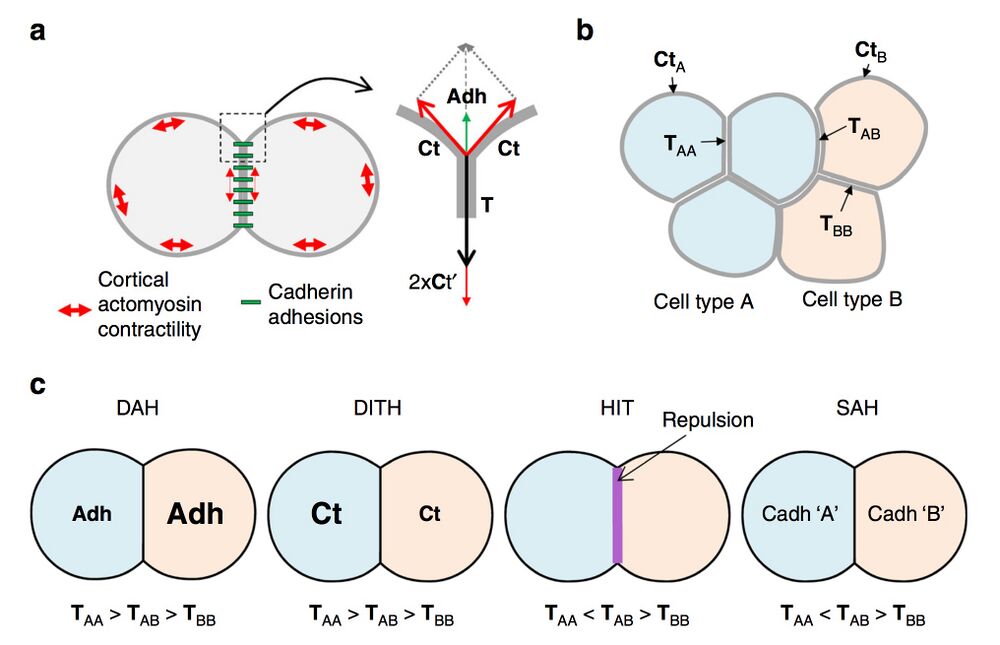
Fig. 1 Contact tension and cell sorting. a Diagram of two adhering cells and representation of the force equilibrium at a contact vertex. The cadherin adhesive structures are represented in green, and the contractility of the actomyosin cell cortex by red double arrows. Note that cadherin adhesions influence the cell cortex, decreasing tension along contacts (smaller double arrows). The equilibrium of forces at a vertex involves the cortical tension Ct at the free surface of each cell and the contact tension T between the two cells. T is the sum of the two cortical tensions at the contact (Ct′) and of cell–cell adhesion (Adh), which acts in the opposite direction to expand the contact. b Contact tensions in tissues. TAA and TBB represent tensions at homotypic contacts. TAB represents the contact tension at heterotypic contacts, also called here interfacial tension. c Comparison of the four models for cell sorting and separation based on contact tensions. In the differential adhesion hypothesis (DAH) and the differential interfacial tension hypothesis (DITH), the two cell populations have different homotypic tensions, and the heterotypic tension is intermediate. Repulsive mechanisms such as those generated by ephrin-Eph signalling generate high interfacial tension (HIT). The same situation can be achieved in the selective adhesion hypothesis (SAH), due to preferential homotypic cadherin interactions
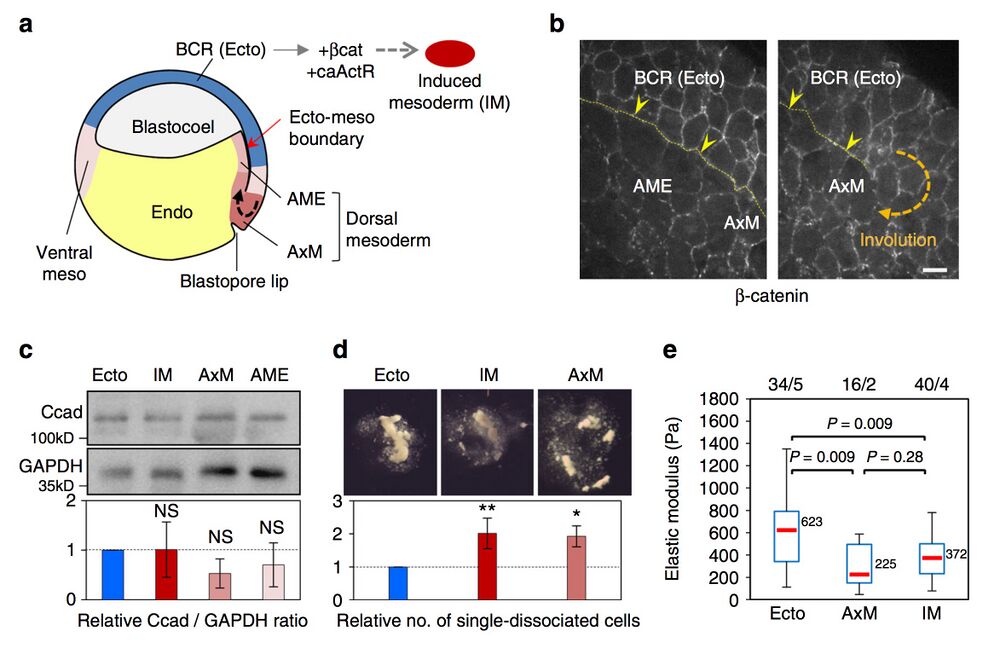
Fig. 2 Xenopus ectoderm and mesoderm and their adhesive and contractile properties. a Diagram of the early Xenopus gastrula indicating the regions used as the source for tissue explants. Induced mesoderm was produced by expression of β-catenin (β-cat) and constitutively active Activin receptor (caActR) in the blastocoel roof (BCR). b Distribution of adhesive structures in the ectoderm blastocoel roof (BCR or Ecto), anterior mesendoderm (AME) and axial mesoderm (AxM) visualised by β-catenin immunostaining. The thin yellow dotted line and yellow arrowheads point to the mature (left panel) or nascent (right panel) ectoderm–mesoderm boundary. Scale bar, 20 μm. See also Supplementary Fig. 1b (c–e). Characterisation of adhesive and contractile properties. c Total cadherin levels in dissected tissues determined by immunoblot and expressed as the relative ratio to GAPDH. Graph shows mean values from seven independent experiments. Error bars, s.d. NS: not significantly different from ectoderm, based on one-sided Student’s t-test. d Resistance to dissociation, measured as the number of single-dissociated cells, normalised as the ratio to ectoderm. Mean of four independent experiments. Individual comparisons were made using one-sided Student’s t-test. *P < 0.05; **P < 0.01. Error bars, s.d. e Cortical tension. The elastic modulus of single cells was determined using AFM. The box plots show the interquartile range (box limits), median (centre line and corresponding value), and min and max values without outliers (whiskers). Number of cells/experiments are indicated on top. Individual comparisons were done using Tukey’s HSD test after a significant one-way ANOVA (P = 5.7e−08)
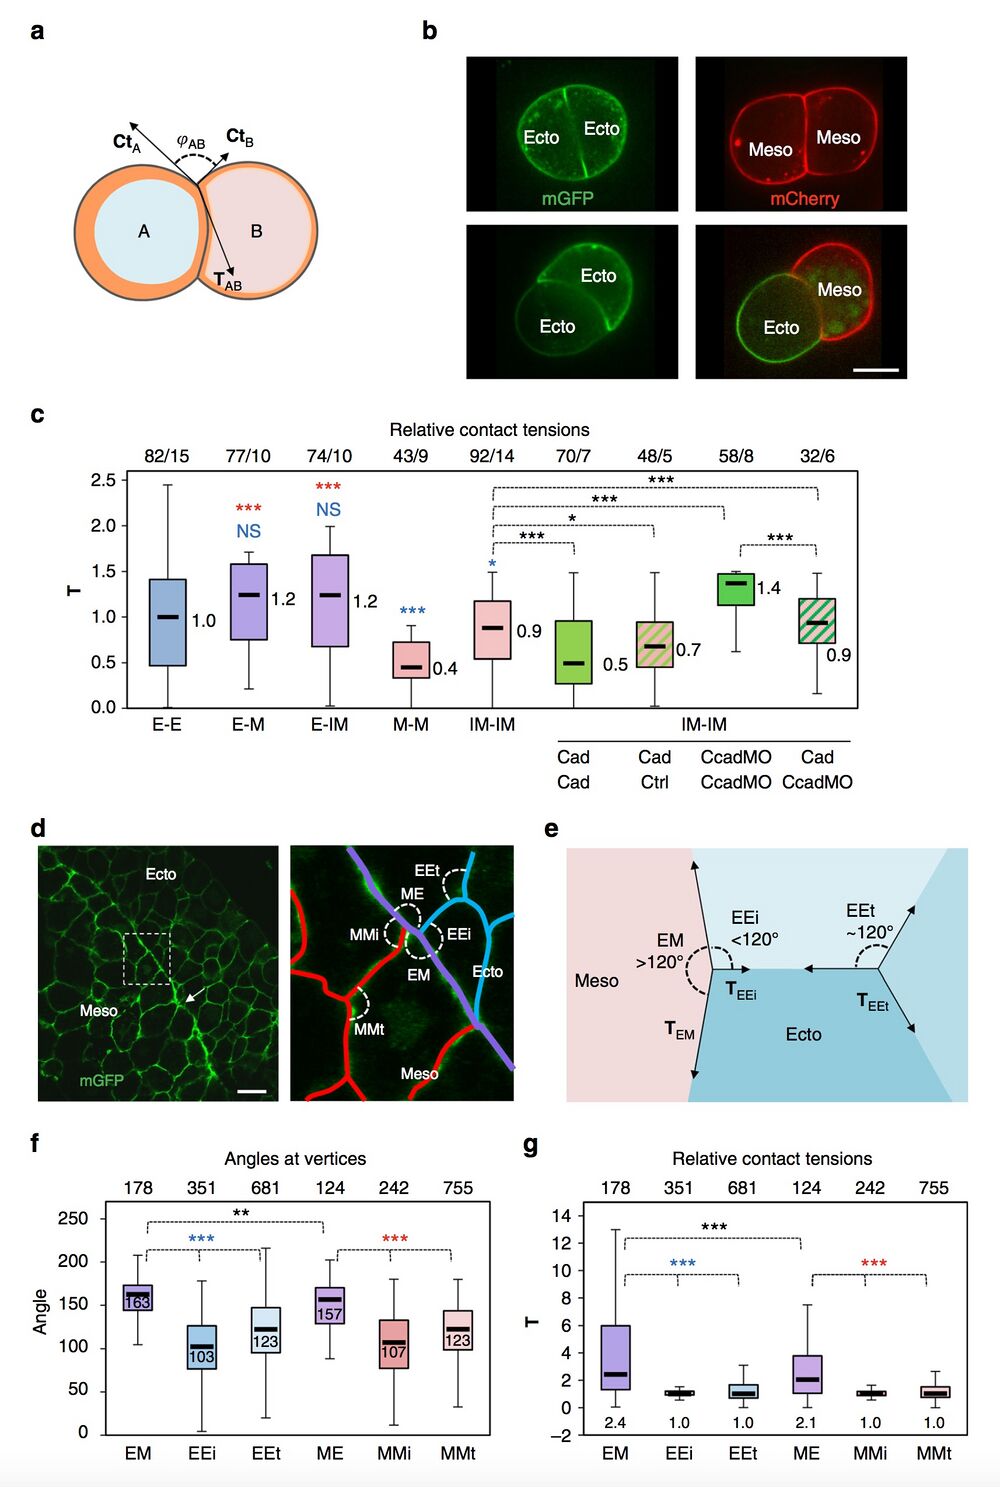
Fig. 3 Estimates of relative contact tensions. a–c Estimates based on the geometry of cell doublets. a Diagram of cell doublet, representing the balance between CtA, CtB and TAb. φAB is the angle formed between CtA and CtB. The orange layer symbolises the actomyosin cortex. A curved cell–cell interface reflects unequal CtA and CtB tensions. b Examples of homotypic and heterotypic doublets, expressing membrane-targeted GFP or Cherry. Scale bar, 15 μm. c Relative T for different types of doublets, calculated based on measurements of angles at vertices and on the Ct values obtained by AFM (Fig. 2e) (detailed calculation in Supplementary Methods). E ectoderm, M mesoderm, IM induced mesoderm. Also shown combinations of IM doublets made of control (ctrl), cadherin-overexpressing (Cad) or cadherin-depleted cells (CcadMO). Box plot as above. The numbers on top of the graph are number of measured angles/number of experiments. Individual comparisons were done using one-sided Student’s t-test. *P < 0.05, **P < 0.01, ***P < 0.001, NS not significant. A colour code was used to indicate comparison to control mesoderm (red) or to ectoderm (blue). d–g Estimates based on the geometry of cells within tissues. d Section of dorsal ectoderm and mesoderm expressing mGFP. Right panel: Enlargement of the boundary area, with homophilic contacts highlighted in blue and red, and the heterophilic boundary interface in purple. Angles formed at vertices between different types are indicated: EM and ME, angles between heterotypic contacts; EEi and MMi, angles between heterotypic and homotypic contacts at the tissue interface; EEt and MMt, angles between homotypic contacts inside each tissue. Scale bar, 30 μm. e Representation of vector forces at vertices. Angles at a vertex within an ideal homogenous tissue should be around 120°. Tissue boundaries tend to be straighter, thus, EM and ME angles are larger than EEi and MMi angles. Such asymmetry is indicative of higher contact tension. f, g Angle measurements and calculated relative T (Supplementary Methods). T at heterotypic contacts is about twice as high as at homotypic contacts. Measurements from 12 embryos. Plots and statistics with colour code as above.
Adapted with permission from Springer Nature: Canty et al. (2017). Sorting at embryonic boundaries requires high heterotypic interfacial tension. Nat Commun. July 31, 2017; 8 (1): 157. DOI: 10.1038/s41467-017-00146-x. Copyright 2017.
This work is licensed under a Creative Commons Attribution 4.0 International License. The images or other third party material in this article are included in the article’s Creative Commons license, unless indicated otherwise in the credit line; if the material is not included under the Creative Commons license, users will need to obtain permission from the license holder to reproduce the material. To view a copy of this license, visit http://creativecommons.org/licenses/by/4.0/
Last Updated: 2017-08-30