Chromatin accessibility and transcription factor activity (during gastrulation)
Combinatorial transcription factor activities on open chromatin induce embryonic heterogeneity in vertebrates
Ann Rose Bright, Siebe van Genesen, Qingqing Li, Alexia Grasso, Siebren Frölich, Maarten van der Sande, Simon J van Heeringen, Gert Jan C Veenstra
EMBO J (2021) e104913 https://doi.org/10.15252/embj.2020104913
Click here to view article at The EMBO Journal.
Click here to view article at Pubmed.
Click here to view article on Xenbase.
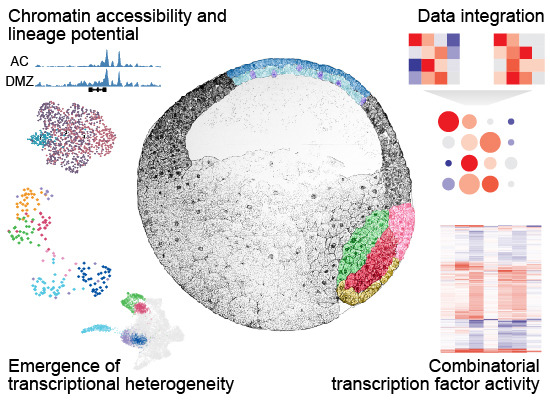
· Open chromatin closely reflects lineage potential
· Identification of developmental key regulators by integration of single cell chromatin accessibility and transcriptomic data
· Evidence for bipotent neuromesodermal, head organizer and trunk organizer cells as early as the early gastrula
· Transcription factors cooperate in a combinatorial fashion in zygotic gene regulation
Mesoderm induction, dorsal‐ventral patterning, and establishment of the dorsal axis involve transcriptional heterogeneity at the gastrula stage of vertebrate embryogenesis. Single‐cell chromatin‐accessibility and transcriptomic analyses identify the contribution and cooperation of key transcription factors in zygotic gene expression.
Abstract
During vertebrate gastrulation, mesoderm is induced in pluripotent cells, concomitant with dorsal‐ventral patterning and establishing of the dorsal axis. We applied single‐cell chromatin accessibility and transcriptome analyses to explore the emergence of cellular heterogeneity during gastrulation in Xenopus tropicalis. Transcriptionally inactive lineage‐restricted genes exhibit relatively open chromatin in animal caps, whereas chromatin accessibility in dorsal marginal zone cells more closely reflects transcriptional activity. We characterized single‐cell trajectories and identified head and trunk organizer cell clusters in early gastrulae. By integrating chromatin accessibility and transcriptome data, we inferred the activity of transcription factors in single‐cell clusters and tested the activity of organizer‐expressed transcription factors in animal caps, alone or in combination. The expression profile induced by a combination of Foxb1 and Eomes most closely resembles that observed in the head organizer. Genes induced by Eomes, Otx2, or the Irx3‐Otx2 combination are enriched for maternally regulated H3K4me3 modifications, whereas Lhx8‐induced genes are marked more frequently by zygotically controlled H3K4me3. Taken together, our results show that transcription factors cooperate in a combinatorial fashion in generally open chromatin to orchestrate zygotic gene expression.
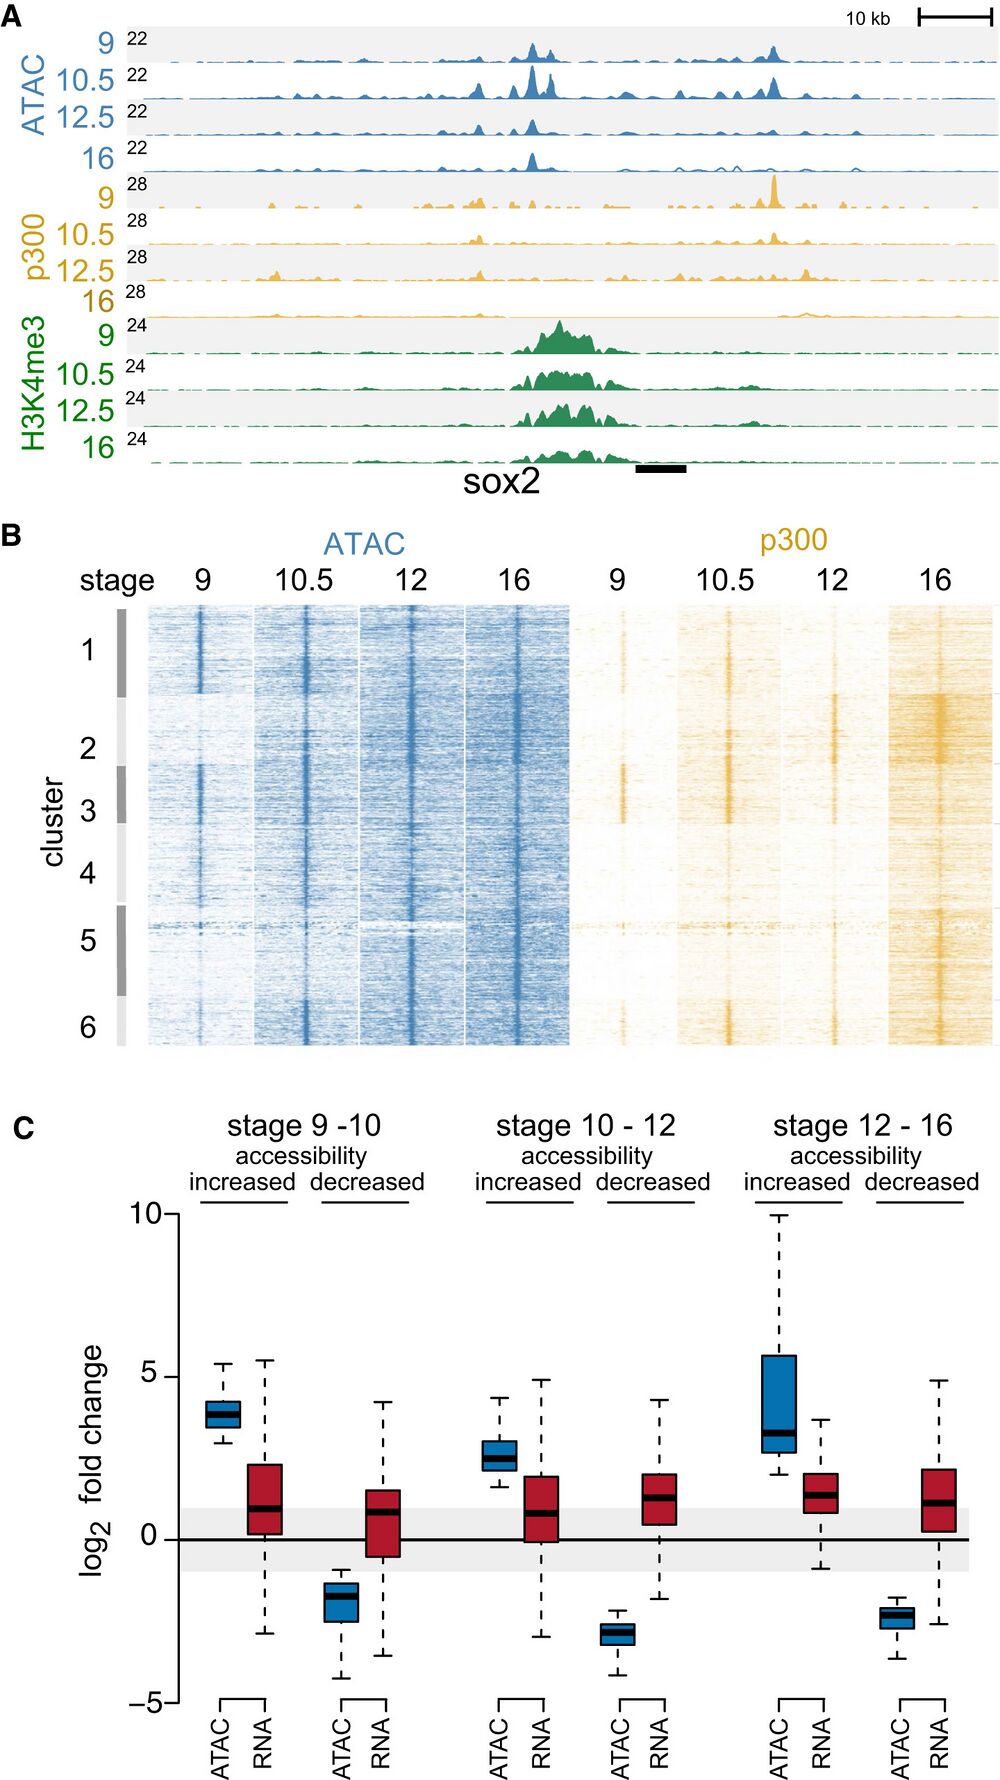
Figure 1. Chromatin accessibility during early development.
A Genome browser view showing chromatin accessibility (ATAC-seq) and ChIP-seq (p300 and H3K4me3) profiles at stage 9, 101⁄2, 12, and 16 at sox2 gene locus. The number at the left (black line) indicates the Y-axis scale of the profile. ATAC-seq peaks were found at promoter (H3K4me3) and enhancer (p300-bound) regulatory regions.
B Chromatin accessibility and p300 binding at differential ATAC-seq peaks visualized using K-means clustering.
C Boxplots showing pair-wise sequential-stage comparisons of fold change in accessibility (ATAC-seq) and corresponding changes in gene expression (RNA-seq data set;
Owens et al, 2016). The data represents two biological replicates. The central band within the boxplot represents the median (50th percentile), the box represents the range between the first and third quartile (25th–75th percentile), and the whiskers show 1.5× the interquartile range (IQR).
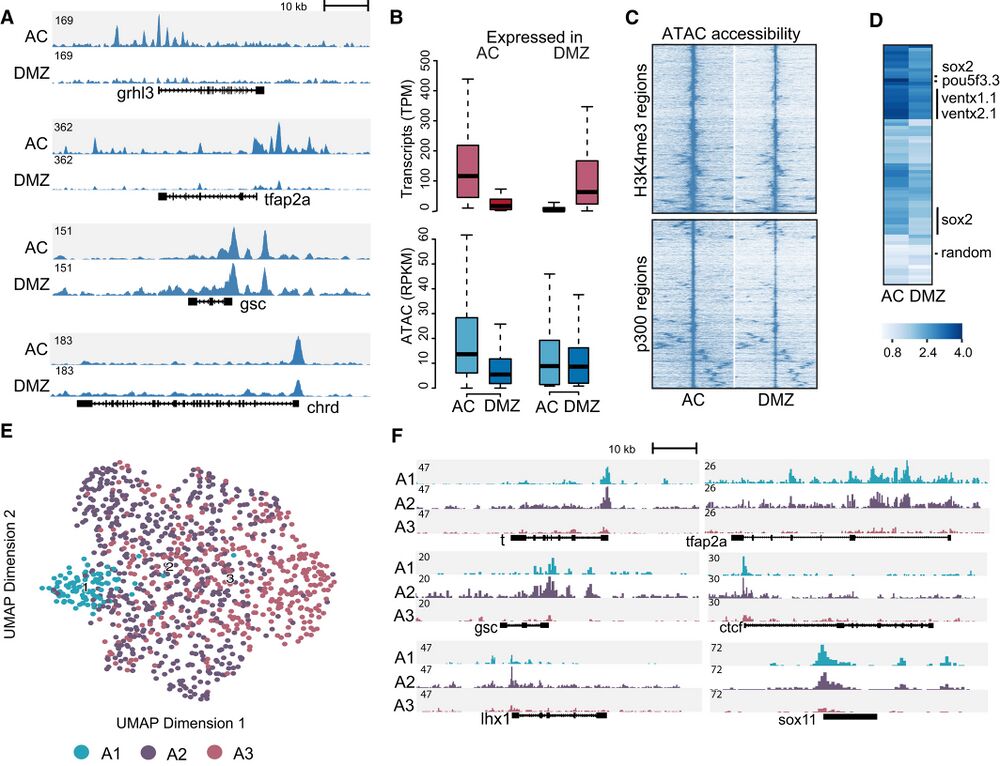
Figure 2. Chromatin accessibility in animal cap (AC) and dorsal marginal zone (DMZ).
A Genome browser view of AC and DMZ accessibility profiles for ectoderm-expressed (tfap2a and grhl3) and organizer-expressed (gsc and chrd) marker genes.
B Boxplots showing differential gene expression (AC versus DMZ) and associated ATAC-seq signals (Two biological replicates). The central band within the boxplot
represents the median and the whiskers show 1.5 times the range between the first and third quartile (IQR).
C Hierarchical clustering of AC and DMZ ATAC-seq data on H3K4me3-positive (top) and p300-positive (bottom) ATAC-seq peaks.
D Heatmap showing accessibility signal (log1p of fold over background) at p300-positive ATAC-seq peaks surrounding pluripotency genes (ventx1/ventx2, pou5f3 and
sox2). The row labeled “random” shows accessibility signals at random genomic loci.
E Single-cell ATAC-seq UMAP projection of cells derived from gastrula stage embryos (stage 101⁄2), colored by cluster.
F Genomic tracks showing aggregated accessibility of single-cell ATAC-seq clusters at the t (tbxt), tfap2a, gsc, ctcf, lhx1 and sox11 loci.
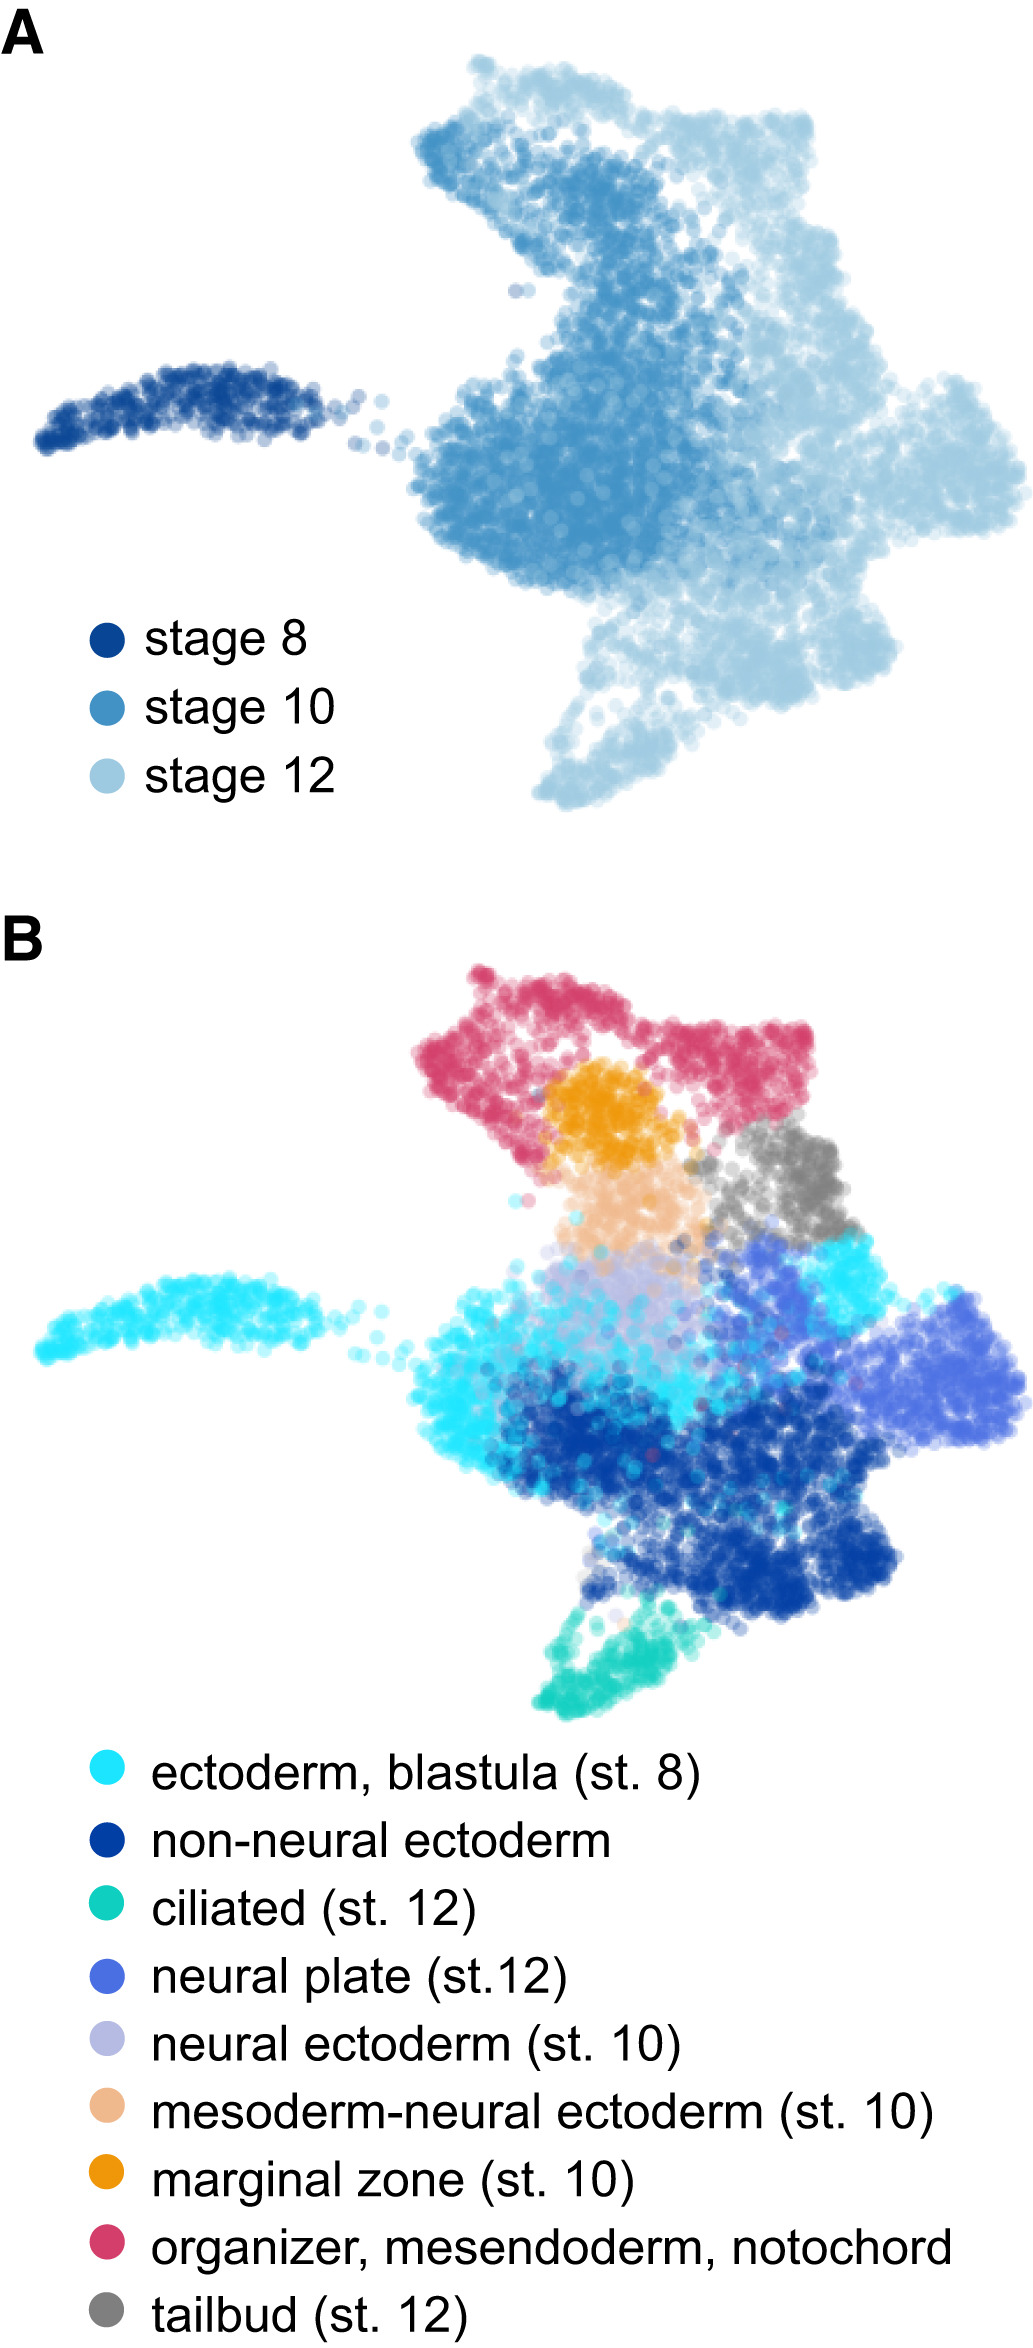
Figure 3. Cellular heterogeneity and developmental trajectories in blastula and gastrula stages.
A, B UMAP visualization of whole embryo scRNA-seq for stages 8, 10, and 12
colored by stage (A) and cell type annotations (B).
Adapted with permission from EMBO Press on behalf of The EMBO Journal: Bright et al. (2021). Combinatorial transcription factor activities on open chromatin induce embryonic heterogeneity in vertebrates. EMBO J (2021) e104913 https://doi.org/10.15252/embj.2020104913
This work is licensed under a Creative Commons Attribution 4.0 International License. The images or other third party material in this article are included in the article’s Creative Commons license, unless indicated otherwise in the credit line; if the material is not included under the Creative Commons license, users will need to obtain permission from the license holder to reproduce the material. To view a copy of this license, visit http://creativecommons.org/licenses/by/4.0/
Last Updated: 2021-02-22