Three-dimensional folding dynamics of the Xenopus tropicalis genome
Three-dimensional folding dynamics of the Xenopus tropicalis genome
Longjian Niu, Wei Shen, Zhaoying Shi, Yongjun Tan, Na He, Jing Wan, Jialei Sun, Yuedong Zhang, Yingzhang Huang, Wenjing Wang, Chao Fang, Jiashuo Li, Piaopiao Zheng, Edwin Cheung, Yonglong Chen, Li Li, Chunhui Hou
Nat Genet. 2021 Jun 7. doi: 10.1038/s41588-021-00878-z.
Click here to view article at Nature Genetics.
Click here to view article on Pubmed.
Abstract
Animal interphase chromosomes are organized into topologically associating domains (TADs). How TADs are formed is not fully understood. Here, we combined high-throughput chromosome conformation capture and gene silencing to obtain insights into TAD dynamics in Xenopus tropicalis embryos. First, TAD establishment in X. tropicalis is similar to that in mice and flies and does not depend on zygotic genome transcriptional activation. This process is followed by further refinements in active and repressive chromatin compartments and the appearance of loops and stripes. Second, within TADs, higher self-interaction frequencies at one end of the boundary are associated with higher DNA occupancy of the architectural proteins CTCF and Rad21. Third, the chromatin remodeling factor ISWI is required for de novo TAD formation. Finally, TAD structures are variable in different tissues. Our work shows that X. tropicalis is a powerful model for chromosome architecture analysis and suggests that chromatin remodeling plays an essential role in de novo TAD establishment.
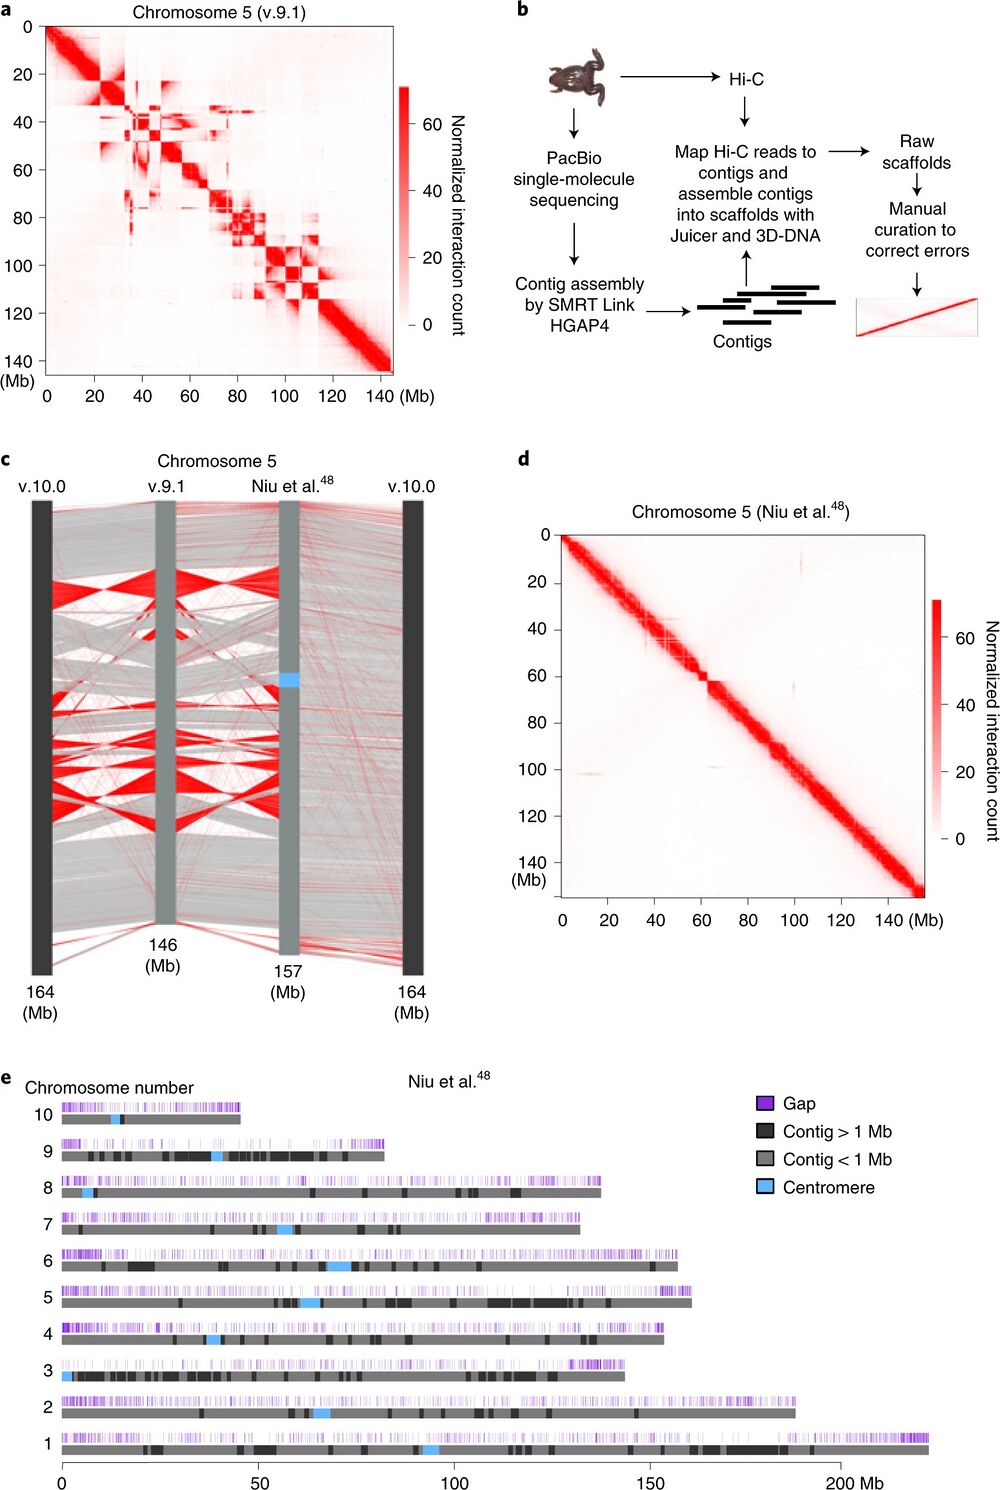
Fig. 1: De novo assembly of the reference genome of X. tropicalis by using Hi-C and single-molecule sequencing. a, Heatmap of chromosome 5 as an example to show assembly errors using the v.9.1 reference genome of X. tropicalis. b, Procedure of de novo assembly of the reference genome of X. tropicalis. c, Comparison between the v.9.1, de novo assembled and v.10.0 chromosome 5. The red lines show sequences with the orientation reversed. d, Heatmap of chromosome 5 to show that assembly errors are mostly corrected in the new version of the reference genome. e, Ideograms of X. tropicalis new reference pseudomolecules. The top track shows the positions of gaps (dark blue). Contigs longer than 1 Mb are shown in black and contigs shorter than 1 Mb are shown in light gray. The Hi-C datasets for genome assembly were generated from s9 embryos.
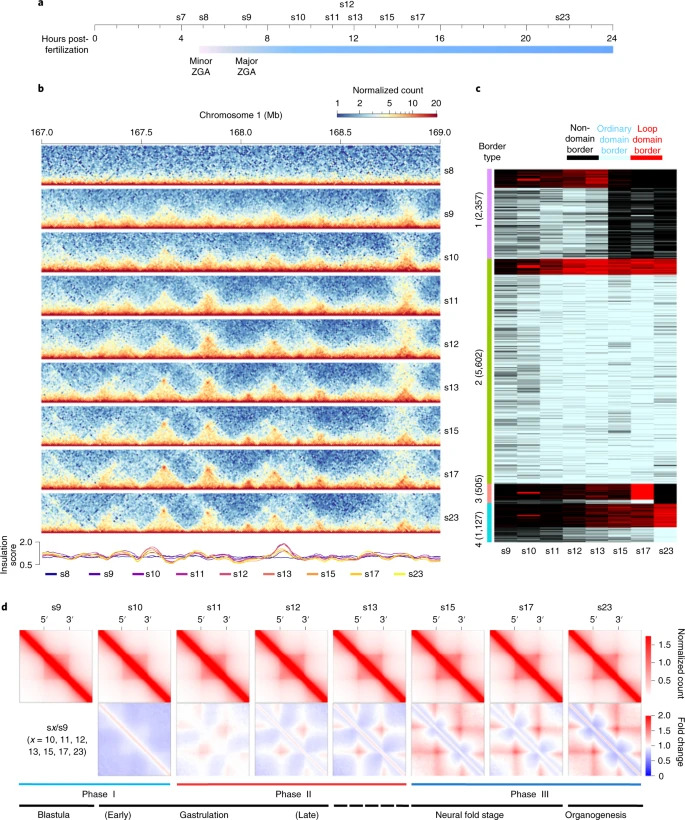
Fig. 2: De novo TAD establishment during embryogenesis of X. tropicalis. Chromatin interaction frequency mapped at a 5-kb resolution. c, Clusters of TAD borders appear for ordinary domains (light blue), loop domains (red) and non-domains (black) at each specific developmental stage. ‘Non-domain border’ refers to a genomic region not identified as a TAD border at a specific embryonic developmental stage, which switches to a TAD border at other development stages. d, Heatmaps of aggregated TADs for the eight developmental stages. The interaction frequency of aggregated TADs from s10 to s23 was normalized against s9. Three phases of change in the TAD structure are shown below, with the developmental stages also shown (TAD number at s9, s10, s11, s12, s13, s15, s17 and s23: 2,471, 2,805, 3,599, 4,036, 4,160, 3,164, 3,609 and 3,199).

Fig. 4: De novo TAD establishment is independent of transcription. a, Western blot of RPB1 in WT embryos at the four developmental stages. b, Western blot of proteins in embryos with RPB1 knocked down by morpholinos and in embryos that were rescued. Note that the CTCF and Rad21 protein levels at delayed s10 were similar to s9 WT. Morpholino control (Ctrl); no morpholino (−); rpb1 morpholino (+); rpb1 rescue. See also Supplementary Table 4 for the rpb1 coding sequence for the rescue experiment. c, Schematic representation of the embryogenesis process arrested by RPB1 knockdown and transcription inhibition by α-amanitin. d, Example of a region showing the RPB1 knockdown effects on TAD structure at s9. e,f, Aggregated and normalized heatmaps for s9 and delayed s9 (e), and s10, s13 and delayed s10 (f) for the RPB1 knockdown experiment. g, Example of a region showing the RPB1 knockdown and rescue effects on TAD structure at s11. h, Western blot of proteins in embryos inhibited with α-amanitin. Note that the CTCF and Rad21 protein levels at s9 sustained were similar to s9 WT. Water as control (Ctrl); no α-amanitin (−); the amount of α-amanitin injected was 2 ng per embryo. All western blot experiments in this figure were repeated at least twice unless otherwise stated. i, Example of a region showing the effects of α-amanitin inhibition on TAD structure. j, Aggregated and normalized TAD analysis for embryos of WT s11 and α-amanitin-inhibited s9 sustained.
Adapted with permission from Springer Nature on behalf of Nature Genetics: Niu et al. (2021). Three-dimensional folding dynamics of the Xenopus tropicalis genome. 2021 Jun 7. DOI: 10.1038/s41588-021-00878-z.
This work is licensed under a Creative Commons Attribution 4.0 International License. The images or other third party material in this article are included in the article’s Creative Commons license, unless indicated otherwise in the credit line; if the material is not included under the Creative Commons license, users will need to obtain permission from the license holder to reproduce the material. To view a copy of this license, visit http://creativecommons.org/licenses/by/4.0/
Last Updated: 2021-06-14