Multiciliated cells probe mechanical environment during epithelial integration
The addition of new cells into a tissue is a key process in sculpting organs during normal development, but it is also subverted during the metastatic spread of cancer cells. While much is known about the molecular signals that control this process, whether mechanical information plays a role in this process is unknown. Ventura and Amiri et al. reveal how migrating cells in the Xenopus embryo join a tissue by using finger-like extensions (filopodia) to read mechanical information from the neighboring cells. This multi-disciplinary work, combining the exciting fields of developmental biology and theoretical physics, is the product of an international team of scientists from the Sedzinski Lab at Novo Nordisk Foundation Center for Stem Cell Medicine (reNEW), the Doostmohammadi Lab at the Niels Bohr Institute (NBI) and Aboutaleb Amiri at the Max Planck Center for Physics of Living Systems (MPI-PKG). Their findings highlight the importance of mechanical information in directing cell movement during embryonic development, and provide a better understanding of how cellular extensions like filopodia, a common feature in invading cancers, are used to sense neighboring cells.
Multiciliated cells use filopodia to probe tissue mechanics during epithelial integration in vivo.
Ventura G , Amiri A , Thiagarajan R , Tolonen M , Doostmohammadi A , Sedzinski J .
Nat Commun October 28, 2022; 13 (1): 6423.
Click here to view article at Nature Communications.
Click here to view article on Pubmed.
Click here to view article on Xenbase.
Abstract
During embryonic development, regeneration, and homeostasis, cells have to migrate and physically integrate into the target tissues where they ultimately execute their function. While much is known about the biochemical pathways driving cell migration in vivo, we are only beginning to understand the mechanical interplay between migrating cells and their surrounding tissue. Here, we reveal that multiciliated cell precursors in the Xenopus embryo use filopodia to pull at the vertices of the overlying epithelial sheet. This pulling is effectively used to sense vertex stiffness and identify the preferred positions for cell integration into the tissue. Notably, we find that pulling forces equip multiciliated cells with the ability to remodel the epithelial junctions of the neighboring cells, enabling them to generate a permissive environment that facilitates integration. Our findings reveal the intricate physical crosstalk at the cell-tissue interface and uncover previously unknown functions for mechanical forces in orchestrating cell integration.
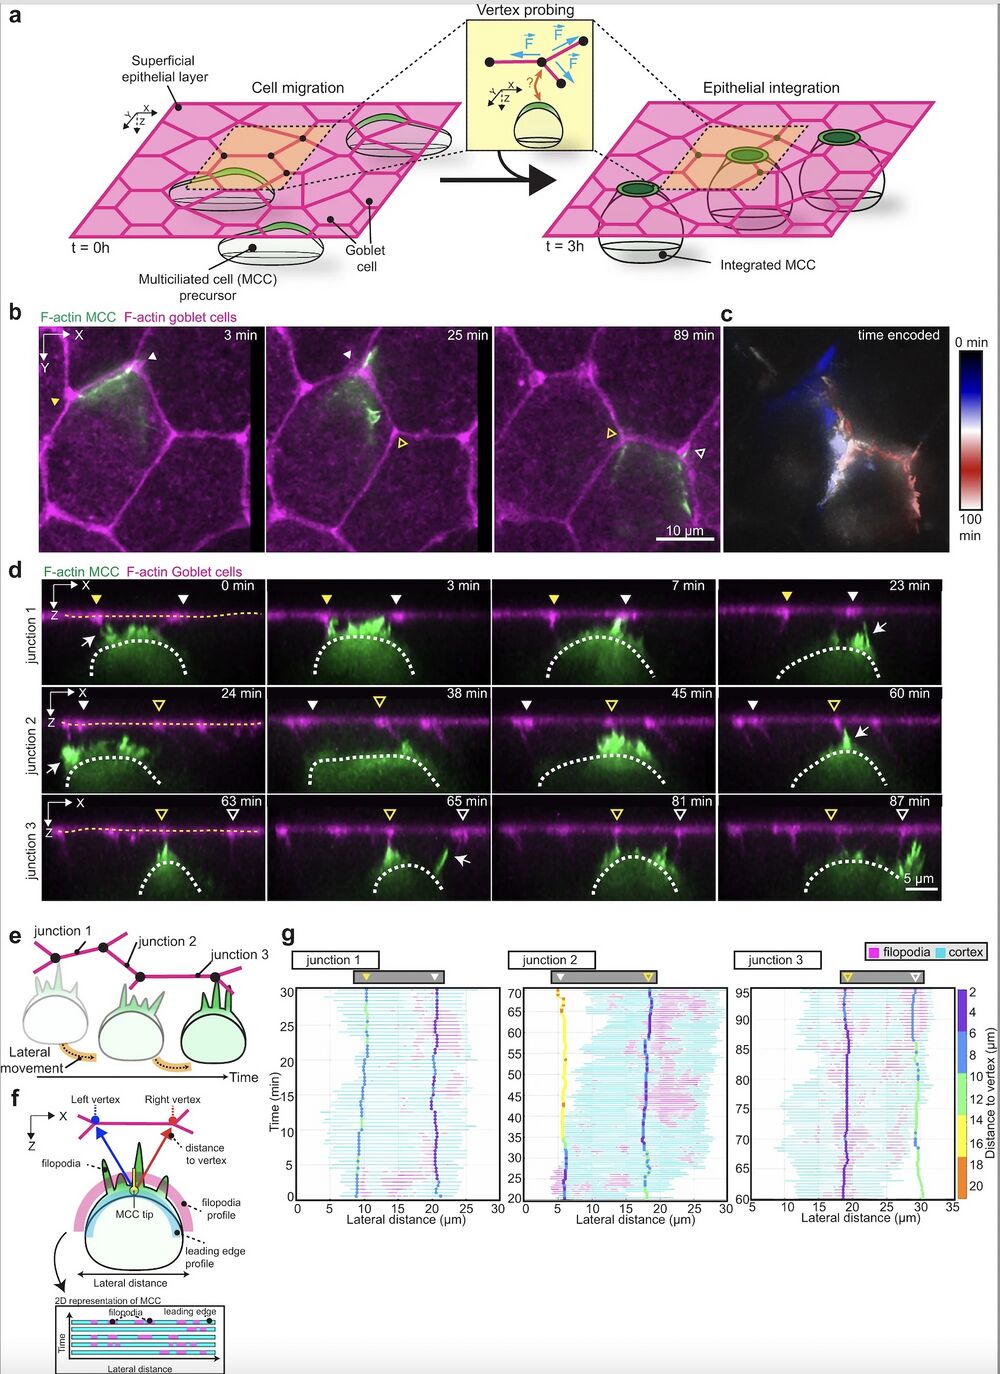
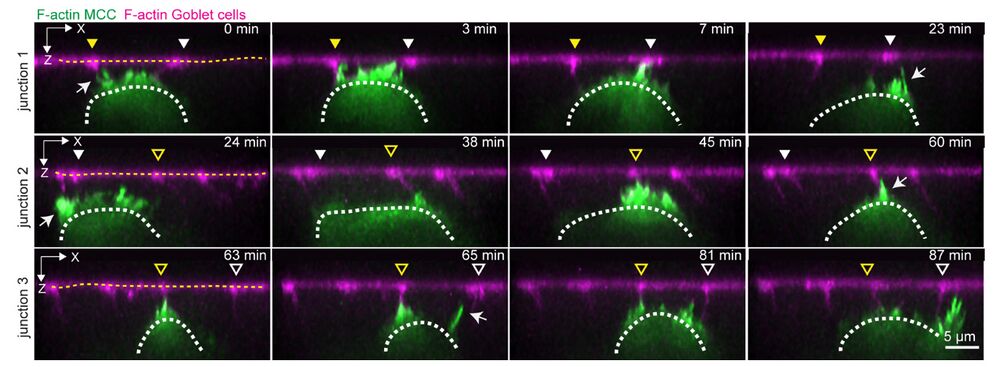
Fig. 1: Multiciliated cells probe the neighboring environment during integration. a Schematics representing multiciliated cell (MCC) integration into the superficial epithelium. MCCs (in green) migrate into the superficial epithelium (t = 0 h) to integrate at the epithelial vertices formed by the neighboring goblet cells (in magenta) (t = 3 h). Inset depicts vertex probing by a single MCC. Epithelial vertices (black dots) form hotspots of mechanical tension as connecting junctions (magenta) pull on the vertex (blue arrows). b–g Dynamics of vertex probing by MCCs. MCC expresses α-tubulin::LifeAct-GFP (pseudo-colored in green) while goblet cells express nectin::utrophin-RFP (pseudo-colored in magenta). Yellow and white arrowheads, with and without fill, mark the position of different vertices and white arrows point to filopodia. b Image sequence from XY projection of MCC moving in between the overlying goblet cells. Scale bar: 10 μm. c Temporal-color-coded XY projection of MCC in b. d Orthogonal (XZ) projections of MCC in b used for filopodia dynamics analysis. White dotted lines outline the MCC contour and yellow dotted lines outline the top of the superficial epithelium. Arrowheads mark the position of the epithelial vertices. Scale bar: 5 μm. e Schematics representing the lateral movement of integrating MCCs. f Schematic representation of the main components of the filopodia analysis pipeline (see “Methods”). g Filopodia analysis of integrating MCC from d. The relative position of F-actin protrusions (filopodia, magenta) extended by a single MCC from its leading-edge (cyan, each line representing an individual time point) and the overlying epithelial vertices (vertical tracks, color-coded for the distance to vertex (between the MCC tip and the left or right vertex)) during MCC lateral movement. Arrowheads mark the position of the epithelial vertices as in d.
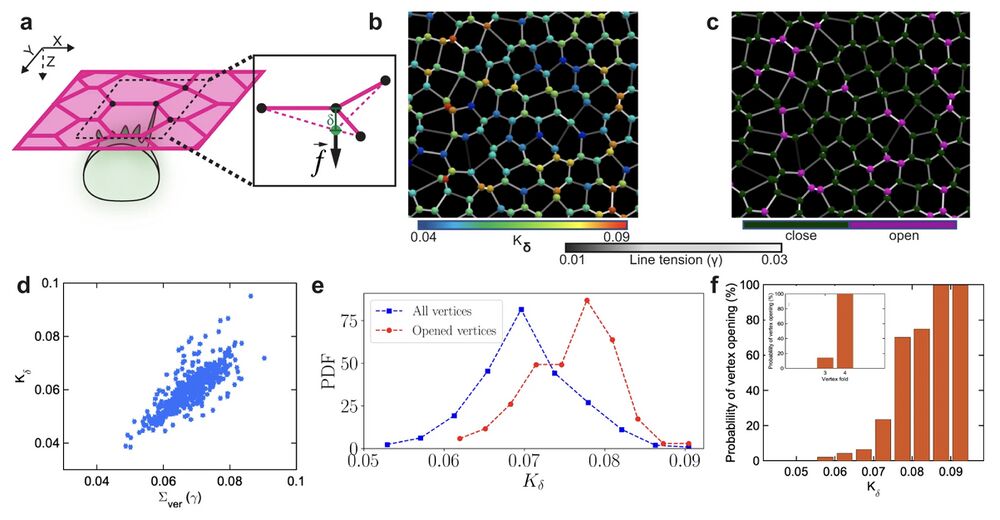
Fig. 3: Vertex model predicts that vertices with higher-fold and net line tension provide preferred spots for MCC integration. a Schematics represent the out-of-plane force (f) exerted by an integrating MCC on an epithelial vertex inducing an out-of-plane displacement (δ). b Representative snapshot of the simulated cellular network. The colormap on junctions indicates line tension (γ), while the vertices are color-coded according to their stiffness (Kδ). c Representative snapshot of the cellular network illustrating propensity of vertices to open upon cell integration. Purple (dark green) vertices mark vertices with successful (failed) insertions. d Vertex stiffness increases with the increasing sum of line tensions at each vertex. e The probability density function (PDF) of the vertex stiffness distributions for all vertices in the simulated cellular network (blue) and the vertices with successful integration events were (red). f The probability of vertex opening for varying vertex stiffness values. The inset shows the opening probability for threefold vs. fourfold vertices.
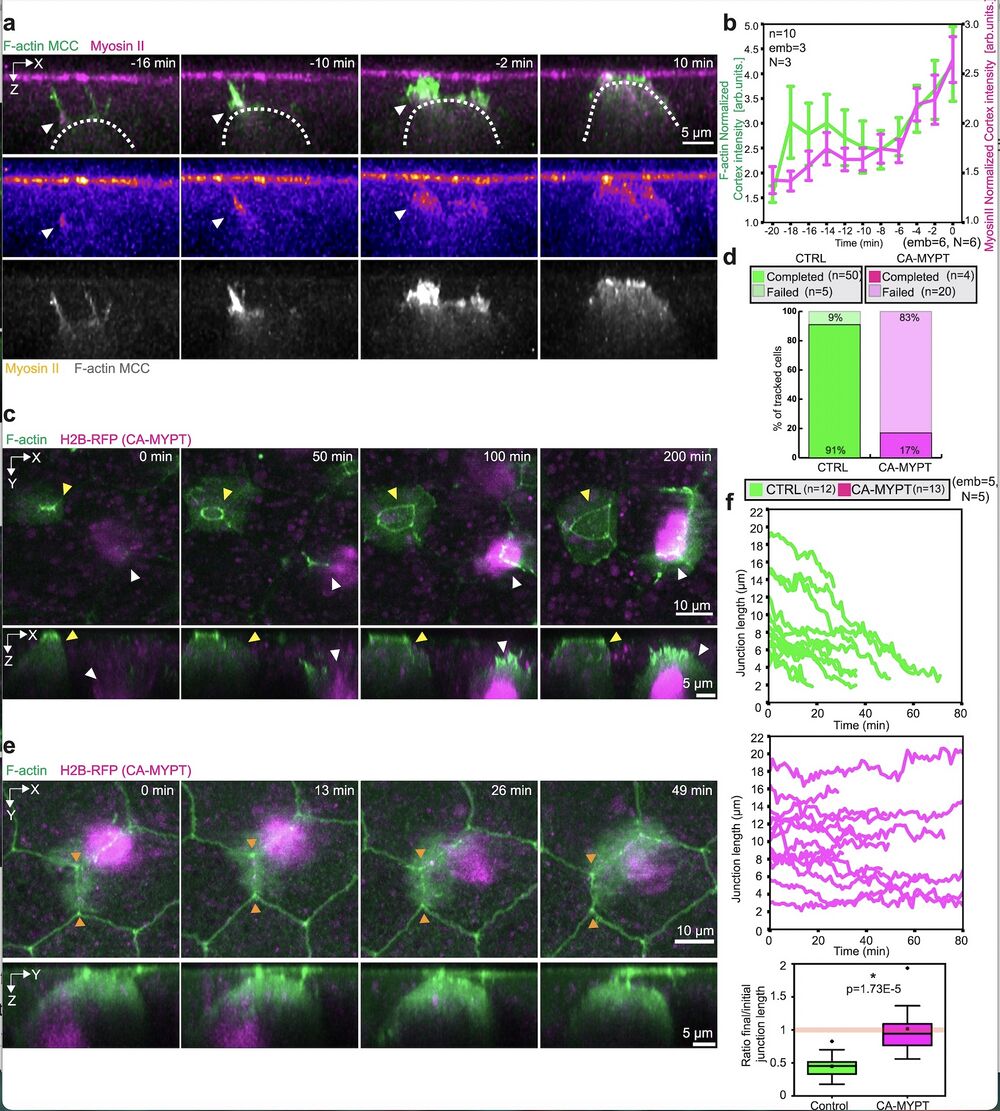
Fig. 6: Myosin II is specifically required in the MCCs for integration and epithelial junction remodeling. a Orthogonal (XZ) projections of myosin II recruitment to the MCC leading edge during integration. MCC is labeled with α-tubulin::LifeAct-GFP (pseudo-colored in green in the composite image, pseudo-colored in gray as a separate channel) and myosin-II is labeled with the myosin intrabody SF9-3xGFP (pseudo-colored in magenta in the composite image, fire pseudo-colored as a separate channel). White arrowheads depict myosin recruitment. Scale bar: 5 μm. b Normalized myosin-II intensity (magenta) and normalized F-actin intensity (green) at the cortex of integrating MCCs. T = 0 marks the last tracked frame during integration (n = 10 cells from 3 embryos, N = 3 experiments). Data show mean ± SEM. c Image sequence of control MCC (yellow arrowhead) and CA-MYPT-overexpressing MCC (white arrowhead, marked with H2B-RFP pseudo-colored in magenta) during integration. Control and CA-MYPT overexpressing MCC express LifeAct-GFP mRNA (pseudo-colored in green). Scale bar: 10 μm. d Quantification of MCC integration success rates for control and CA-MYPT overexpressing cells (nWT = 55 cells, nCA-MYPT = 24 cells from 5 embryos, N = 5 experiments). e Image sequence of a CAMYPT-overexpressing MCC attempting epithelial junction remodeling (orange arrowheads). Goblet cells and CA-MYPT overexpressing MCC express LifeAct-GFP mRNA (pseudo-colored in green). Scale bar: 5 μm. f Junction length tracking for control (green) and CA-MYPT-overexpressing MCCs (magenta) (nWT = 12 junctions, nCAMYPT = 13 junctions from 5 embryos, N = 5 experiments). Boxplots of final to initial junction length ratio in control and CA-MYPT MCCs. The orange line indicates no overall junctional remodeling (final to initial junction length ratio = 1). Boxes extend from the 25th to 75th percentiles, with a line at the median and whiskers representing range within 1.5 interquartile range. Two-tailed Mann–Whitney test with 0.05 significance level *p = 1.73E−5.
Adapted with permission from Springer Nature on behalf of Nature Communications: Ventura and Amiri et al. (2022). Multiciliated cells use filopodia to probe tissue mechanics during epithelial integration in vivo. Nat Commun. 2022 Oct 28;13(1):6423. doi: 10.1038/s41467-022-34165-0.
This work is licensed under a Creative Commons Attribution 4.0 International License. The images or other third party material in this article are included in the article’s Creative Commons license, unless indicated otherwise in the credit line; if the material is not included under the Creative Commons license, users will need to obtain permission from the license holder to reproduce the material. To view a copy of this license, visit http://creativecommons.org/licenses/by/4.0/
Last Updated: 2022-11-29