Membrane potential affects pluripotency
Embryonic stem cells have the potential to be converted into any tissue of the body. However, to exploit this potential, we need to understand how these stem cells transition from pluripotent cells, capable of becoming any cell type, to differentiated cells, specifically a certain type of cells for example liver cells or bone cells. We demonstrate that the electrical properties of these embryonic stem cells can play a critical role in this transition, opening new avenues of electrical manipulation to push cells to stay pluripotent or transition to differentiated.
Membrane potential drives the exit from pluripotency and cell fate commitment via calcium and mTOR
Sempou E , Kostiuk V , Zhu J , Cecilia Guerra M , Tyan L , Hwang W , Camacho-Aguilar E , Caplan MJ , Zenisek D , Warmflash A , Owens NDL , Khokha MK .
Nat Commun. 2022 Nov 5;13(1):6681. doi: 10.1038/s41467-022-34363-w.
Click here to view article at Nature Communications.
Click here to view article on Pubmed.
Click here to view article on Xenbase.
Abstract
Transitioning from pluripotency to differentiated cell fates is fundamental to both embryonic development and adult tissue homeostasis. Improving our understanding of this transition would facilitate our ability to manipulate pluripotent cells into tissues for therapeutic use. Here, we show that membrane voltage (Vm) regulates the exit from pluripotency and the onset of germ layer differentiation in the embryo, a process that affects both gastrulation and left-right patterning. By examining candidate genes of congenital heart disease and heterotaxy, we identify KCNH6, a member of the ether-a-go-go class of potassium channels that hyperpolarizes the Vm and thus limits the activation of voltage gated calcium channels, lowering intracellular calcium. In pluripotent embryonic cells, depletion of kcnh6 leads to membrane depolarization, elevation of intracellular calcium levels, and the maintenance of a pluripotent state at the expense of differentiation into ectodermal and myogenic lineages. Using high-resolution temporal transcriptome analysis, we identify the gene regulatory networks downstream of membrane depolarization and calcium signaling and discover that inhibition of the mTOR pathway transitions the pluripotent cell to a differentiated fate. By manipulating Vm using a suite of tools, we establish a bioelectric pathway that regulates pluripotency in vertebrates, including human embryonic stem cells.
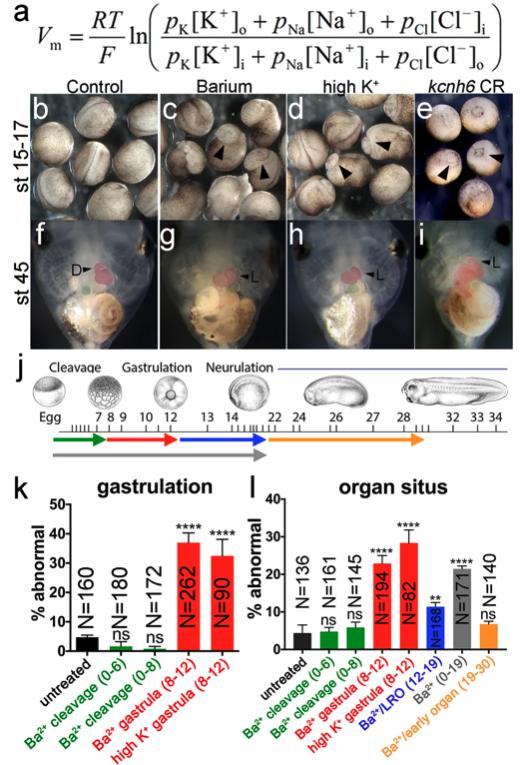
Fig. 1: Membrane potential is important for gastrulation and LR patterning. a GHK equation for Vm; R = gas constant, T = temperature, F = Faraday’s constant, p = permeability for each ion, [X]o = ion concentration outside of cell, [X]i = ion concentration inside the cell. b–i Effects of depolarizing treatments (barium chloride and high K+) and kcnh6 depletion on gastrulation (b–e; stage 15–17 embryos; arrowheads indicate incomplete blastopore closure) and organ situs (f–i; stage 45 tadpoles; ventral views; arrowheads indicate normal (D) and inverse (L) heart looping). j Different stages of barium chloride application (color key in j for bar graphs k and l; green = cleavage stages (stages 0–6 or 0–8); red = gastrulation (stages 8–12); blue = LRO signaling (stages 12–19); orange = early organogenesis (stages 19–30); gray = cleavage through LRO signaling (stages 0–19). Xenopus illustrations © Natalya Zahn (2022) from Xenbase (www.xenbase.org RRID:SCR_003280). k, l Percentages of embryos with incomplete blastopore closure at stage 15 (k) and abnormal organ situs at stage 45 (l) after treatment with barium or high K+ at different stages (see j for color code); p-values are in k: (Ba2+ gastrula vs untreated) = 2.28e–015, (high K+ gastrula vs untreated) = 1.36e–006; in l: (Ba2+ gastrula vs untreated) = 5.85e–007, (high K+ gastrula vs untreated) = 2.08e–008, (Ba2+/LRO vs untreated) = 8.51e–003, and (Ba2+ 0–19 vs untreated) = 1.2e–006. All graphs depict mean ± SEM and report total embryo numbers (N) collected over 3 independent experiments for high K+, and over 2 independent experiments for the 47 h barium time course. Key for asterisks: *p ≤ 0.05, **p ≤ 0.01, ****p ≤ 0.0001, ns nonsignificant with p > 0.05. Source data are provided as a Source Data file.
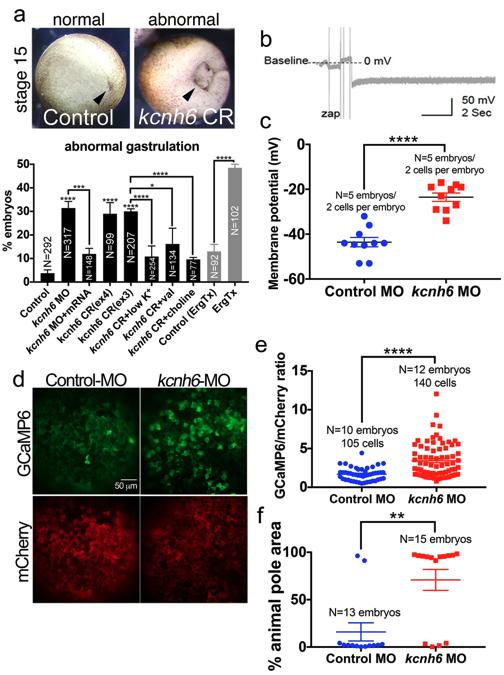
Fig. 3: Membrane potential is important for gastrulation and regulates calcium levels at gastrulation onset. a Percentages of embryos with abnormal gastrulation after depletion of kcnh6 (MO, CRISPR) or Kcnh channel blockade with Ergtoxin, and rescue of kcnh6 depletion with medium conditions that hyperpolarize the Vm (low K+, val valinomycin, sodium substitution with choline; treatments performed stages 8–12). Above: examples of embryos scored for the graph; posterior views (dorsal to the top) of stage 15 embryos after successful (control) or unsuccessful (kcnh6 CRISPR = CR) gastrulation; arrowhead points to blastopore closure. Graph reports mean ± SEM; total embryo numbers (N) in the graph are from 3 independent experiments (except for Ergtoxin: 2 independent experiments with devitellinized embryos); p-values are (kcnh6MO vs Control MO) = 8.66e–010, (kcnh6MO+mRNA vs kcnh6MO) = 2.59e-004, (kcnh6CRex4 vs Control) = 7.19e-018, (kcnh6CRex3 vs Control) = 5.79e-022, (kcnh6CR+low K+ vs kcnh6CR) = 1.64e-005, (kcnh6CR+val vs kcnh6CR+DMSO) = 1.22e-002, (kcnh6CR+choline vs kcnh6CR) = 2.34e-006, (ErgTx vs Control) = 6.57e-010; two-sided Fisher’s exact test. b Representative intracellular recording in the prospective ectoderm of a control stage 10 embryo; Vm is measured relative to the medium (baseline); the dip in membrane potential indicates the electrode breaking into the cell. c The Vm as measured by intercellular recordings in the prospective ectoderm of stage 10 Control MO and kcnh6 MO-injected embryos; graph reports mean ± SEM; p-value (kcnh6MO vs Control MO) is 1.07e-006 (unpaired two-tailed student’s t-test); each data point represents one cell; data from 10 cells/5 embryos/3 independent experiments. d Live animal pole images of GCaMP6/mCherry at stage 10. e Quantification of GCaMP6 fluorescence intensity normalized to mCherry in mCherry+ cells; graph shows mean ± SEM; data points represent single cells; data from N cells (in graph)/10 embryos/3 independent experiments; p = 1.14e-006; unpaired two-tailed student’s t-test. f Maximum area undergoing simultaneous Ca2+ transients within a 20 s time lapse recording as a percentage of total animal pole area; the animal poles of 13 Control MO and 15 Kcnh6 MO embryos were recorded over 3 independent experiments; p = 1.04e-003; unpaired two-tailed student’s t-test. Key for asterisks: *p ≤ 0.05, **p ≤ 0.01, ***p ≤ 0.001, ****p ≤ 0.0001, ns nonsignificant with p > 0.05. Source data are provided as a Source Data file.
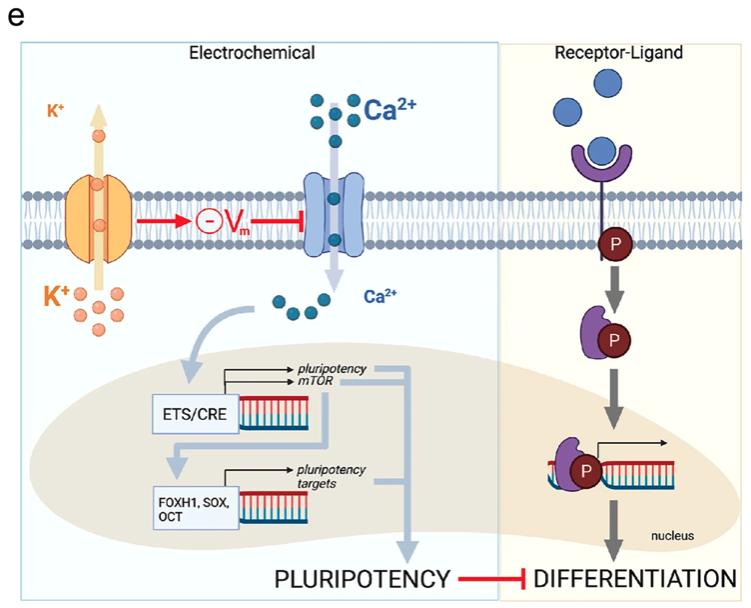
Fig. 8: Potassium channels affect pluripotency in hESCs. [a-d] a Images showing untreated hESCs grown in mTeSR1 media or cells treated with 1 mM Barium or 25 nM Ergtoxin and immunostained for pluripotency factors. Scale bar = 100 μm. b Quantification of the results in a; AU arbitrary units. p-values are Oct4: (control vs Ba) = 0.03, (control vs Erg) = 4.5e-04; Sox2 (control vs Ba) = 0.06, (control vs Erg) = 4.4e-04. c Images showing untreated hESCs grown in MEF-CM media or cells treated with 100 nM rapamycin with or without 25 nM Ergtoxin. Scale bar = 100 μm. d Quantification of the results in c; AU arbitrary units. p-values are Nanog: (control vs Rapa) = 4.5e-04, (control vs Rapa+Erg) = 4.3e-04; Oct4: (control vs Rapa) = 0.002, (control vs Rapa+Erg) = 0.002; Sox2 (control vs Rapa) = 7.7e-04, (control vs Rapa+Erg) = 7.6e-04. Graphs (b) and (d) present mean ± SEM; key for asterisks: *p ≤ 0.05, **p ≤ 0.01; ***p ≤ 0.001; ns nonsignificant for p < 0.05; data were derived from 400 cells/3 independent replicates over at least 2 independent experiments. Source data are provided as a Source Data file. e Model for the onset of embryonic differentiation depicting classical biochemical signaling (right) that is complemented by regulation via membrane potential (left). In the electrophysiological pathway, potassium channels set the membrane potential, which limits activation of voltage-gated calcium channels and suppresses intracellular Ca2+ levels. Both pathways result in changes in gene expression, mediated by intracellular signal transducers (right), or by factors that require calcium (left). While biochemical pathways are essential to induce expression of differentiation factors, the electrophysiological pathway affects cell fate indirectly by controlling the timing of downregulation of pluripotency genes. Adapted from “Transporters”, by BioRender.com (2022). Retrieved from https://app.biorender.com/biorender-templates.
Adapted with permission from Springer Nature on behalf of Nature Communications: Sempou et al. (2022). Membrane potential drives the exit from pluripotency and cell fate commitment via calcium and mTOR. Nat Commun. 2022 Nov 5;13(1):6681. doi: 10.1038/s41467-022-34363-w.
This work is licensed under a Creative Commons Attribution 4.0 International License. The images or other third party material in this article are included in the article’s Creative Commons license, unless indicated otherwise in the credit line; if the material is not included under the Creative Commons license, users will need to obtain permission from the license holder to reproduce the material. To view a copy of this license, visit http://creativecommons.org/licenses/by/4.0/
Last Updated: 2022-11-30