XB-IMG-148947
Xenbase Image ID: 148947
|
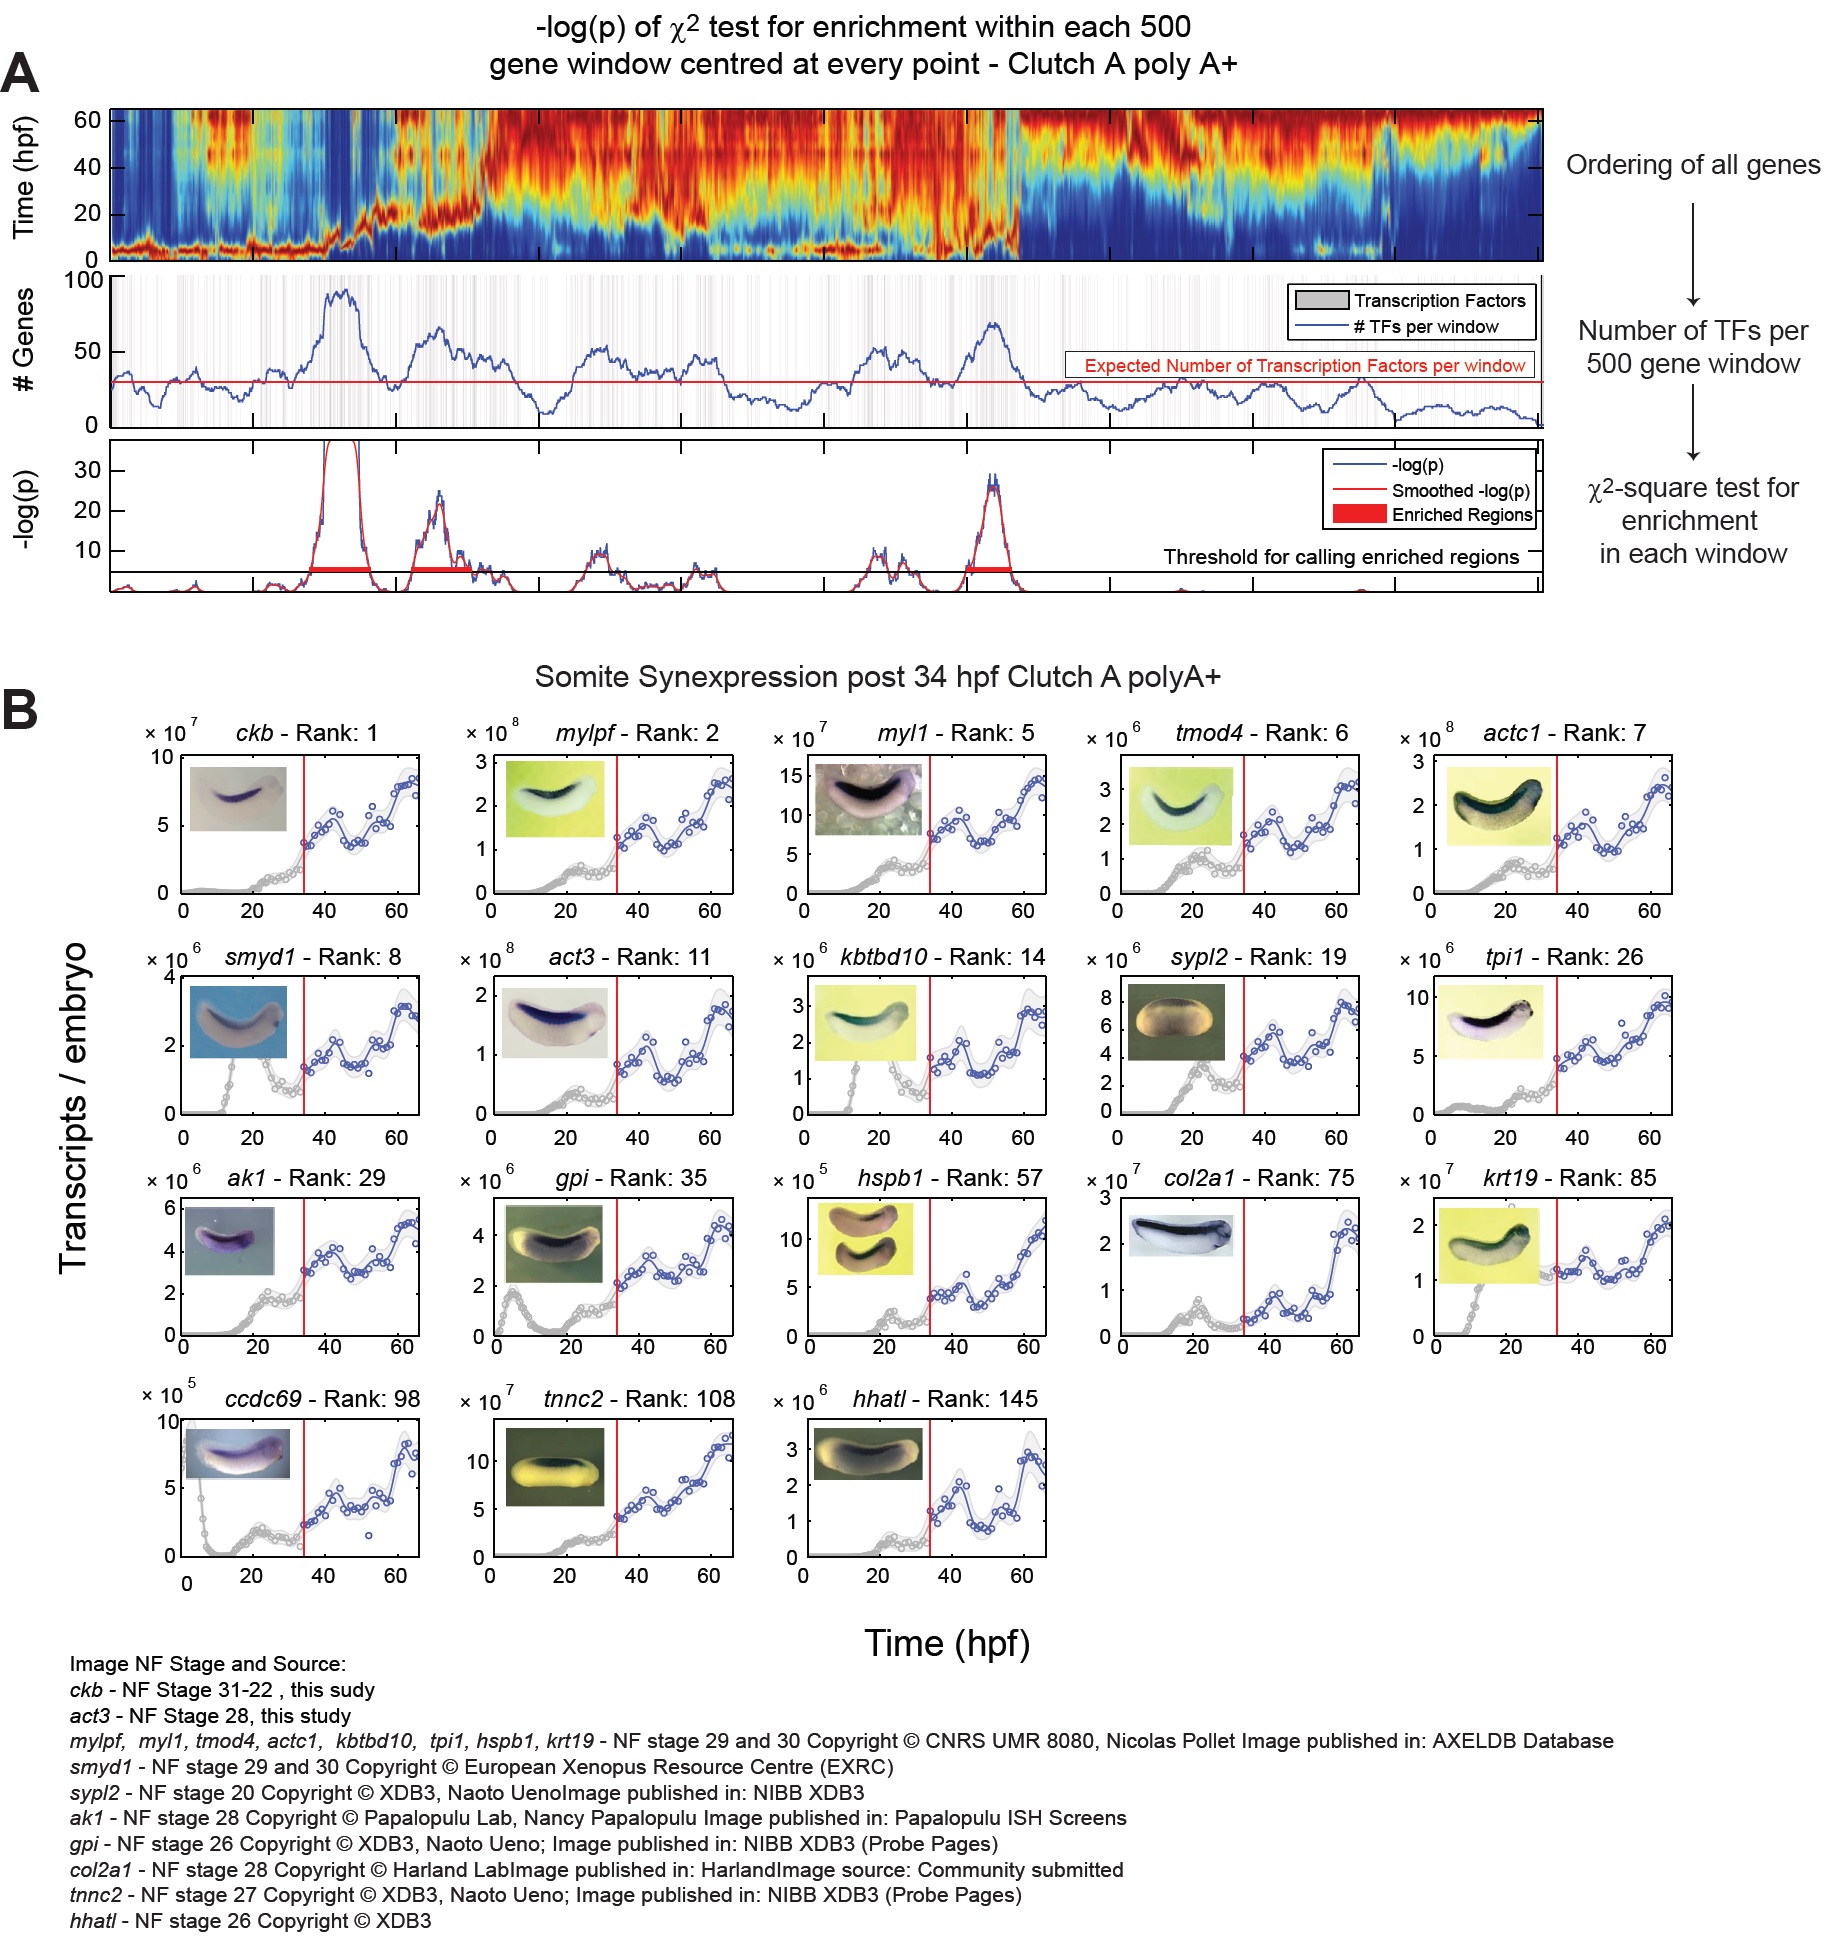
Fig S6 â Temporal synexpression and gene ontology in Clutch A PolyA+, related to Fig 4.
(A) Sliding window gene ontology enrichment. Bottom: Heatmap of all genes (Fig 4) arranged by similarity. Middle: The location
of all transcripts factors, blue line marks the number of transcription factors per 500 gene window. Red line marks the expected
number of transcripts for any 500 gene window. Top: -log(p) chi-squared test for the association between the window position
and the transcription factor density. A region that exceeds âlog(p) > 5 is considered for annotation (Supplemental Experimental
Procedures).
(B) Somite Synexpression. Examples from the somite temporal synexpresssion group. Ranks give similarity to ckb between
34-66 hpf (Supplemental Experimental Procedures). Image source given at bottom. Image published in: Owens ND et al. (2016) Copyright © 2016. Image reproduced with permission of the Publisher and the copyright holder. This is an Open Access article distributed under the terms of the Creative Commons Attribution License.
Image source: Published Larger Image Printer Friendly View |