XB-IMG-150818
Xenbase Image ID: 150818
|
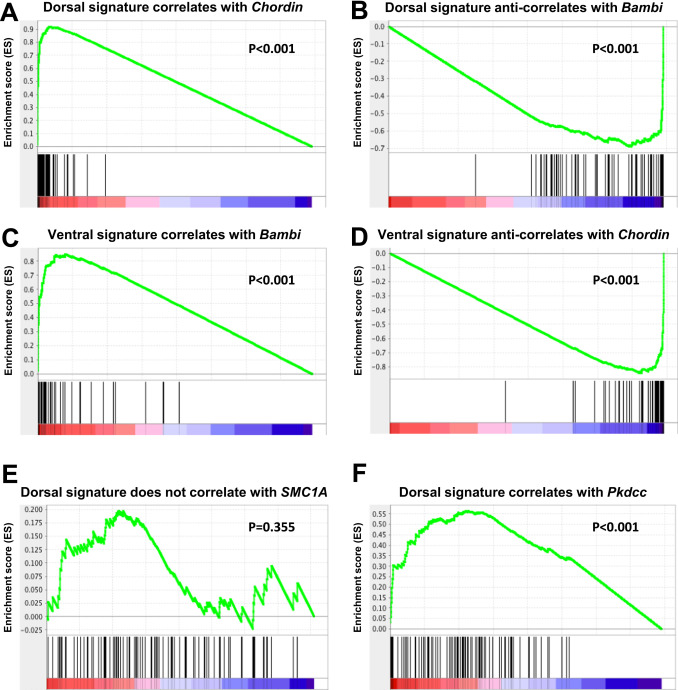
Fig. 4. Gene Set Enrichment Analysis (GSEA) of dorsal and ventral gene signatures. (AâB) The dorsal gene signature (comprised of 107 genes) positively correlated with Chordin (P<0.001), a Spemann organizer marker, and negatively correlated (or anti-correlated) with BAMBI (P<0.001), a marker of ventral tissues. (CâD) The ventral signature (which contains 70 genes) positively correlated with BAMBI (P<0.001), while it negatively correlated with Chordin (P<0.001). (E) SMC1A, used here as a negative control, did not correlate with the dorsal (P=0.355) nor the ventral (not shown) signature. (F) Pkdcc, a novel dorsal gene described here, significantly correlated with the dorsal gene signature (P<0.001). Image published in: Ding Y et al. (2017) Copyright © 2017. Image reproduced with permission of the Publisher, Elsevier B. V. Larger Image Printer Friendly View |