XB-IMG-152372
Xenbase Image ID: 152372
|
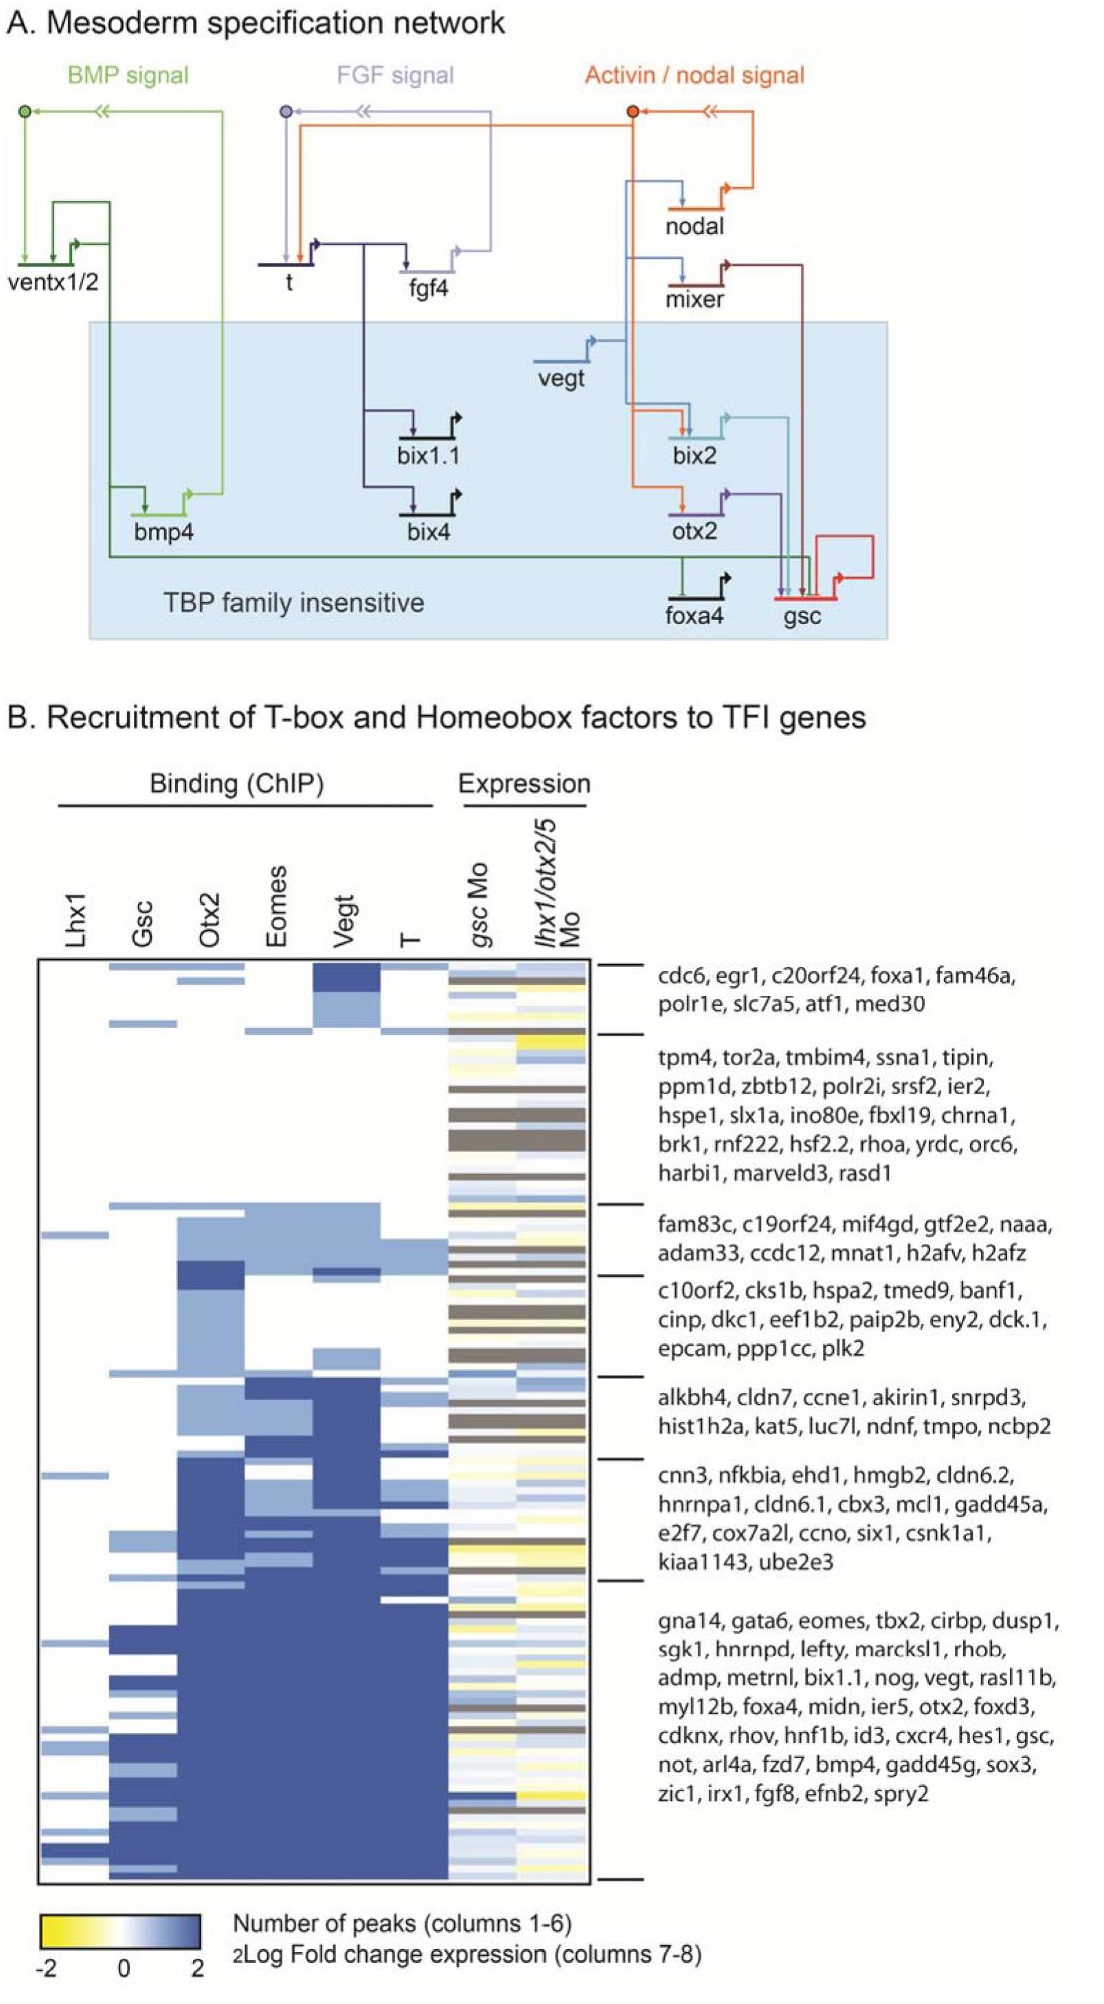
Supplemental Figure S4.
(A) The subset of the mesoderm specification network (Koide et al., 2005) as it relates to TFI genes
(blue box) and BMP, FGF and Activin/nodal signaling.
(B) Hierarchical clustering of TFI genomic interaction network as determined by assigning ChIP‐seq
peaks of Lhx1, Gsc, Otx2, Eomes, Vegt and T (Xbra) to genic regions (Methods). In addition, expression
changes in gsc and lhx1/otx2/otx5 morphant (Mo) embryos are shown (Yasuoka et al., 2014). Color
intensity reflects number of peaks in the locus (ChIP, 0, 1 or >=2 peaks) or Log2 fold expression change
(RNA‐seq, yellow decreased, blue increased, grey not determined). The genes shown to the right
represent all named X. tropicalis TFI genes. Image published in: Gazdag E et al. (2016) © 2016. Creative Commons Attribution license Larger Image Printer Friendly View |