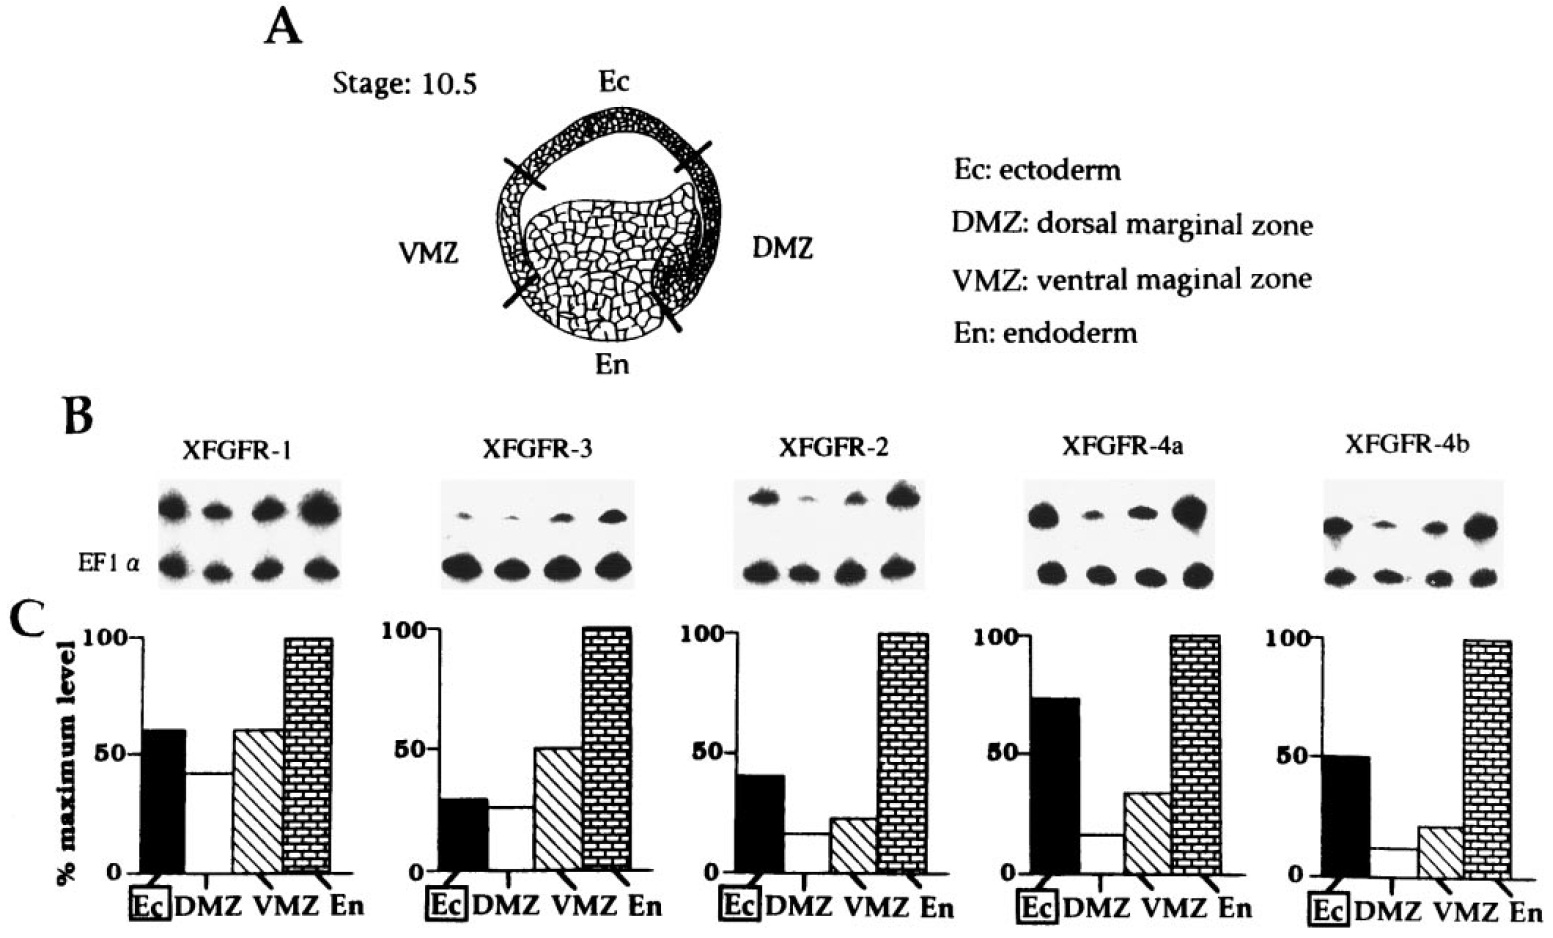
FIG. 6. Regional distribution of XFGFR transcripts. (A) Schematic illustration of dissected regions from ectoderm (Ec), dorsal marginal zone (DMZ), ventral marginal zone (VMZ), and endoderm (En) at an early gastrula stage. (B) Autoradiographs of RT-PCR products of XFGFR transcripts in the four regions defined in (A) coamplified with EF 1a transcript (an internal standard). (C) A quantitative comparison of the spatial expression profiles for transcript levels of five XFGFRs. The intensity of PSL of each RT-PCR product in (B) was measured with a laser image analyzer. The ratio of the intensity of the RT-PCR product for each XFGFR to the intensity of the RT-PCR product for EF1a was calculated from the respective PSL value and illustrated as histograms. The percentage of the maximum values of the ratio is presented in each histogram.
Image published in: Hongo I et al. (1999)
Copyright © 1999. Image reproduced with permission of the Publisher, Elsevier B. V.
Permanent Image Page
Printer Friendly View
XB-IMG-132308